Overview
The Monitoring Dashboard provides users with a comprehensive overview of all registered objects on the platform. It offers an interface that enables users to access snapshot and trend statistics related to various objects, jobs, and users. The dashboard provides various metadata information such as properties, attributes, and statuses, usage and performance of the registered objects.
Monitoring Dashboard is an indispensable tool for platform administrators and users alike, offering a rich set of features to monitor, analyze, and review all elements registered on the platform efficiently.
-
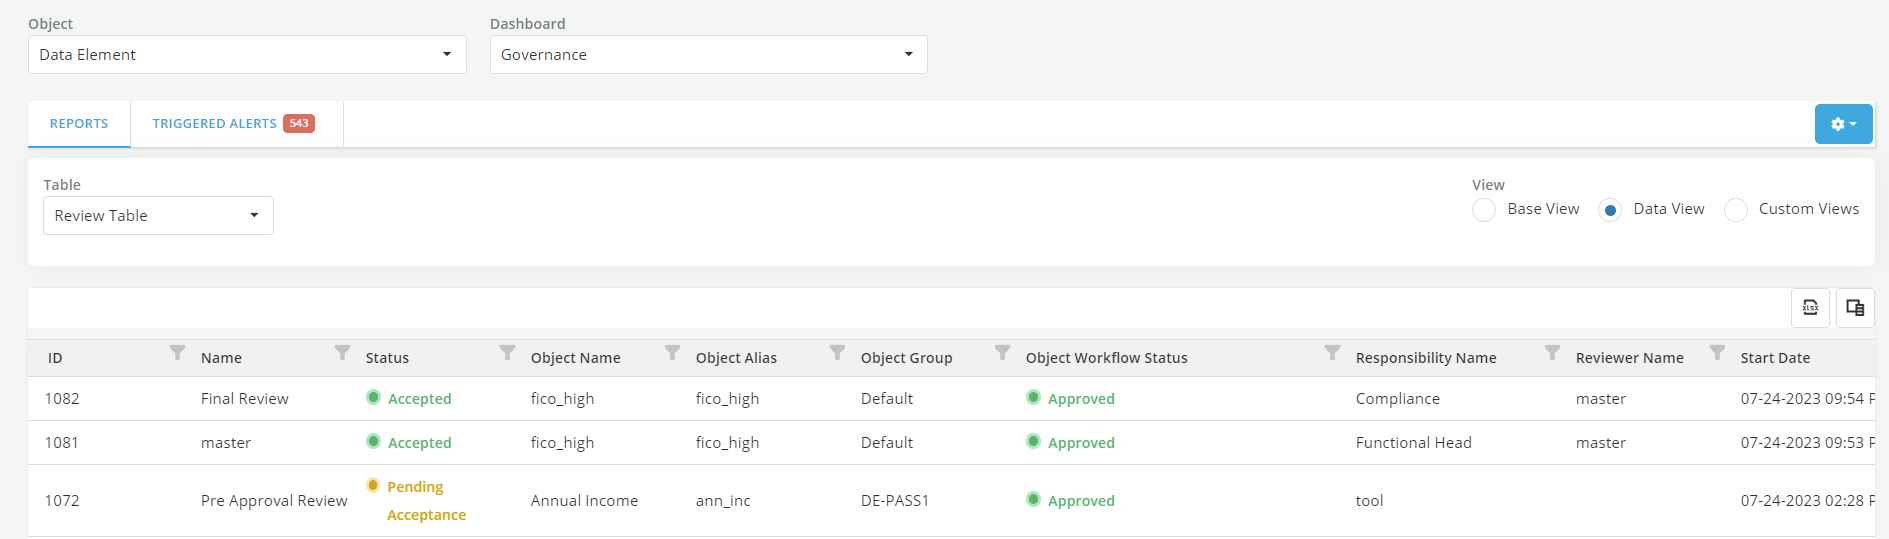
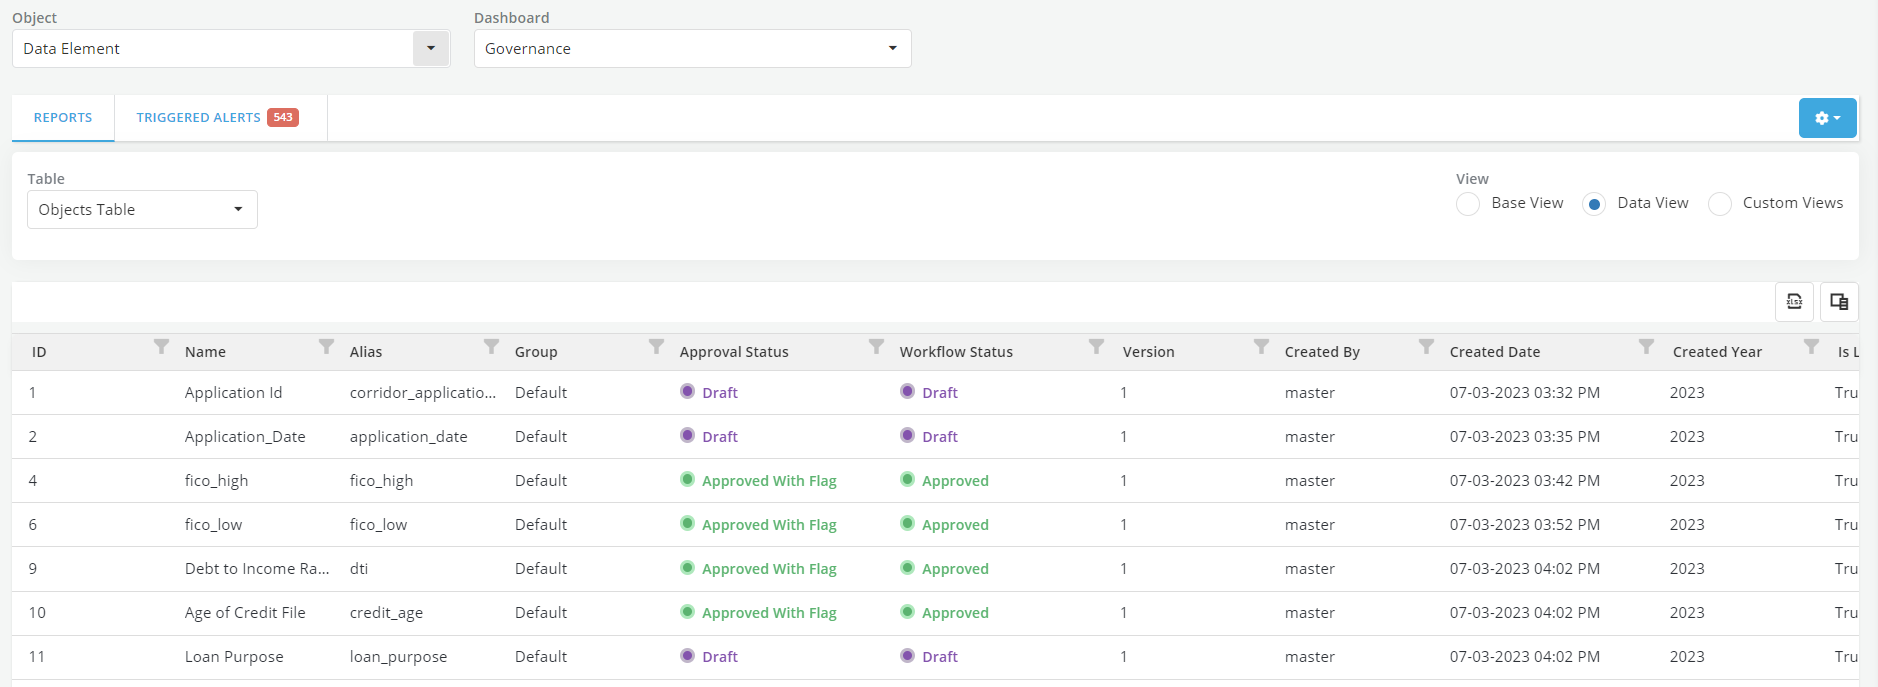
Governance Monitoring Dashboard
- Offers an overview of governance statuses (approvals, reviews,..) of the objects on the platform.
-
Metrics Monitoring Dashboard
- Summarizes tracking metrics for the chosen objects.
-
Permissible Purpose Monitoring Dashboard
- Provides a summary of permissible purpose assignments and violations for all objects under the selected object type.
-
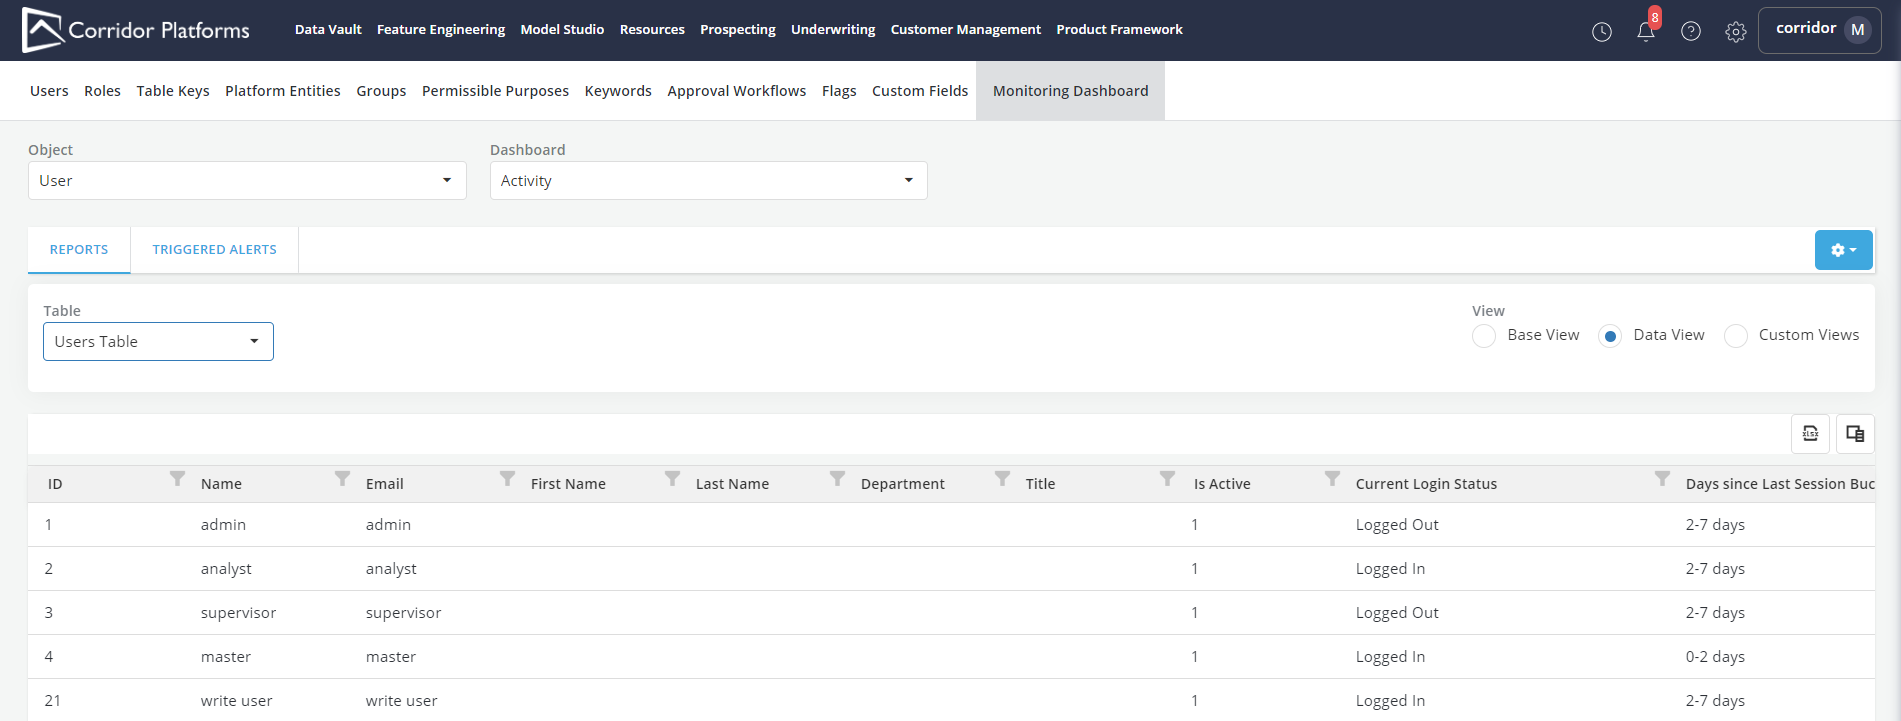
Activity Monitoring Dashboard
- Presents statistics related to user activities on the platform.
Accessing the Monitoring Dashboard
- The Sub-menu of each module includes a specialized Monitoring Dashboard tailored for that specific module.
- To access the Monitoring Dashboard for a specific module, click on the desired module from the navigation menu, and then locate the Monitoring Dashboard option within the corresponding sub-menu.
- Click on Monitoring Dashboard tab.
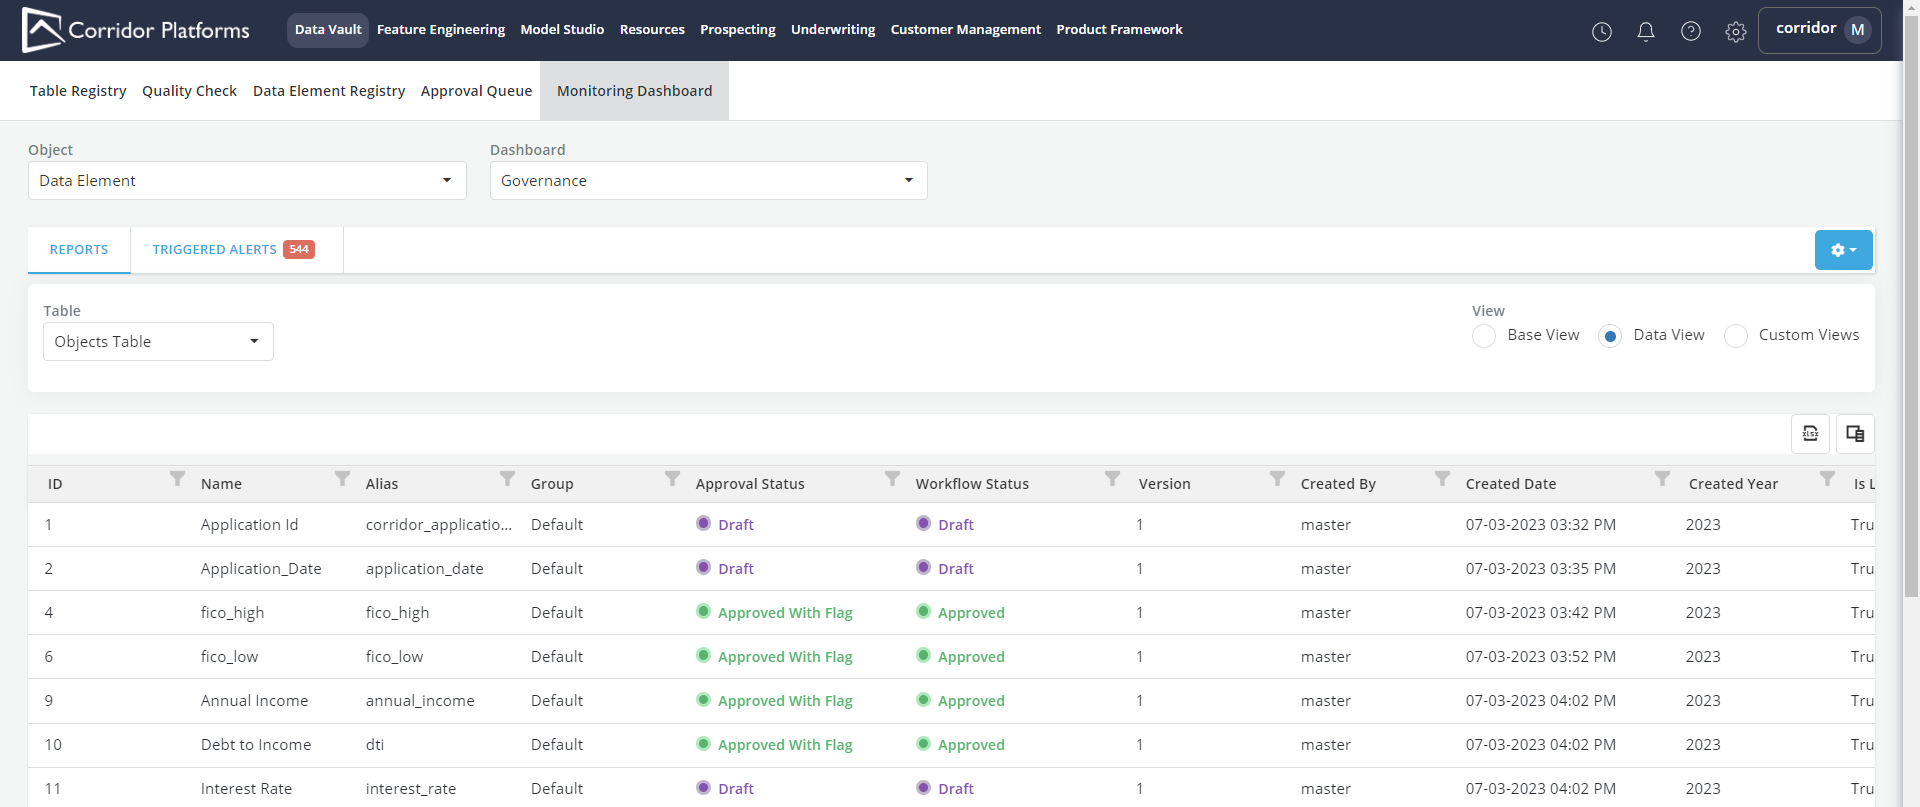
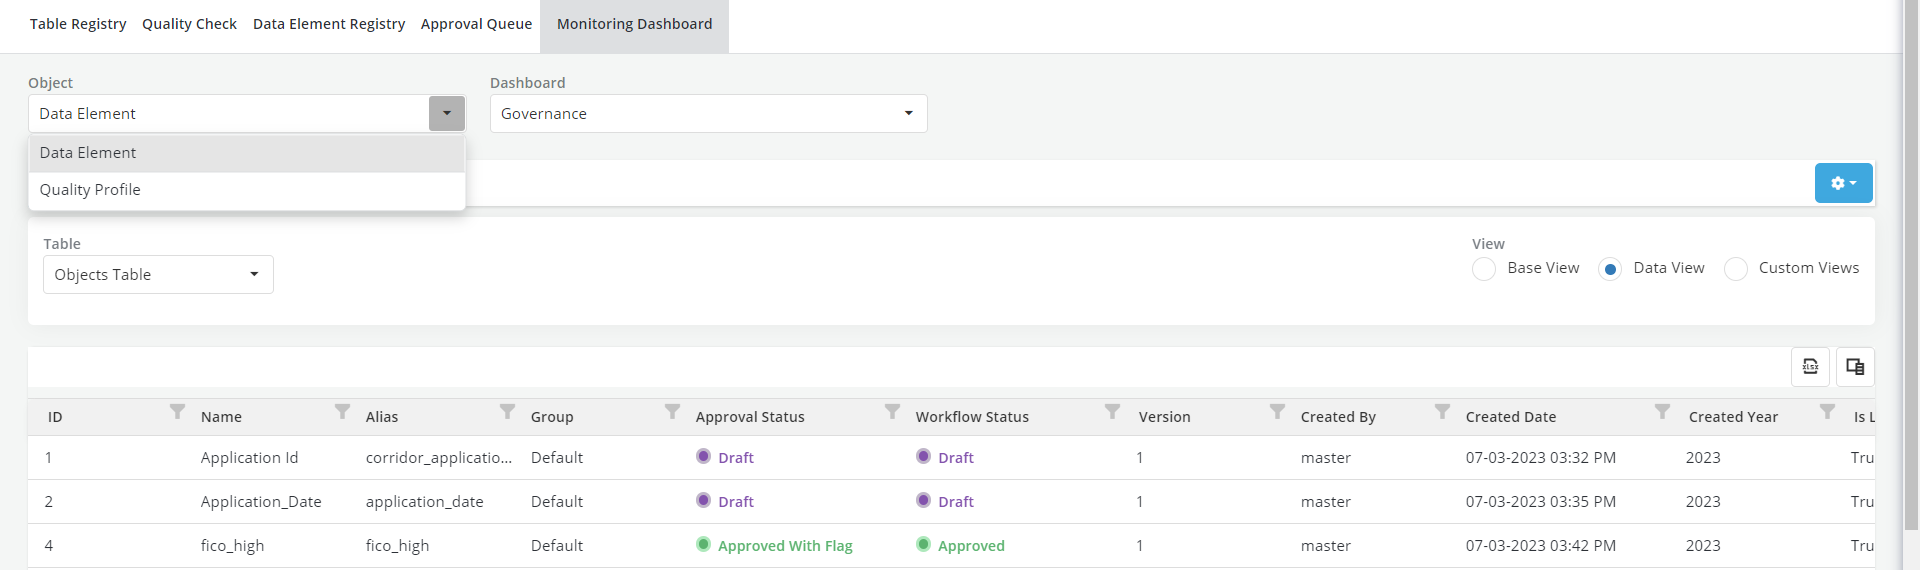
- Click on Object and select an object type to populate the monitoring dashboard with statistics filtered for the selected object type.
-
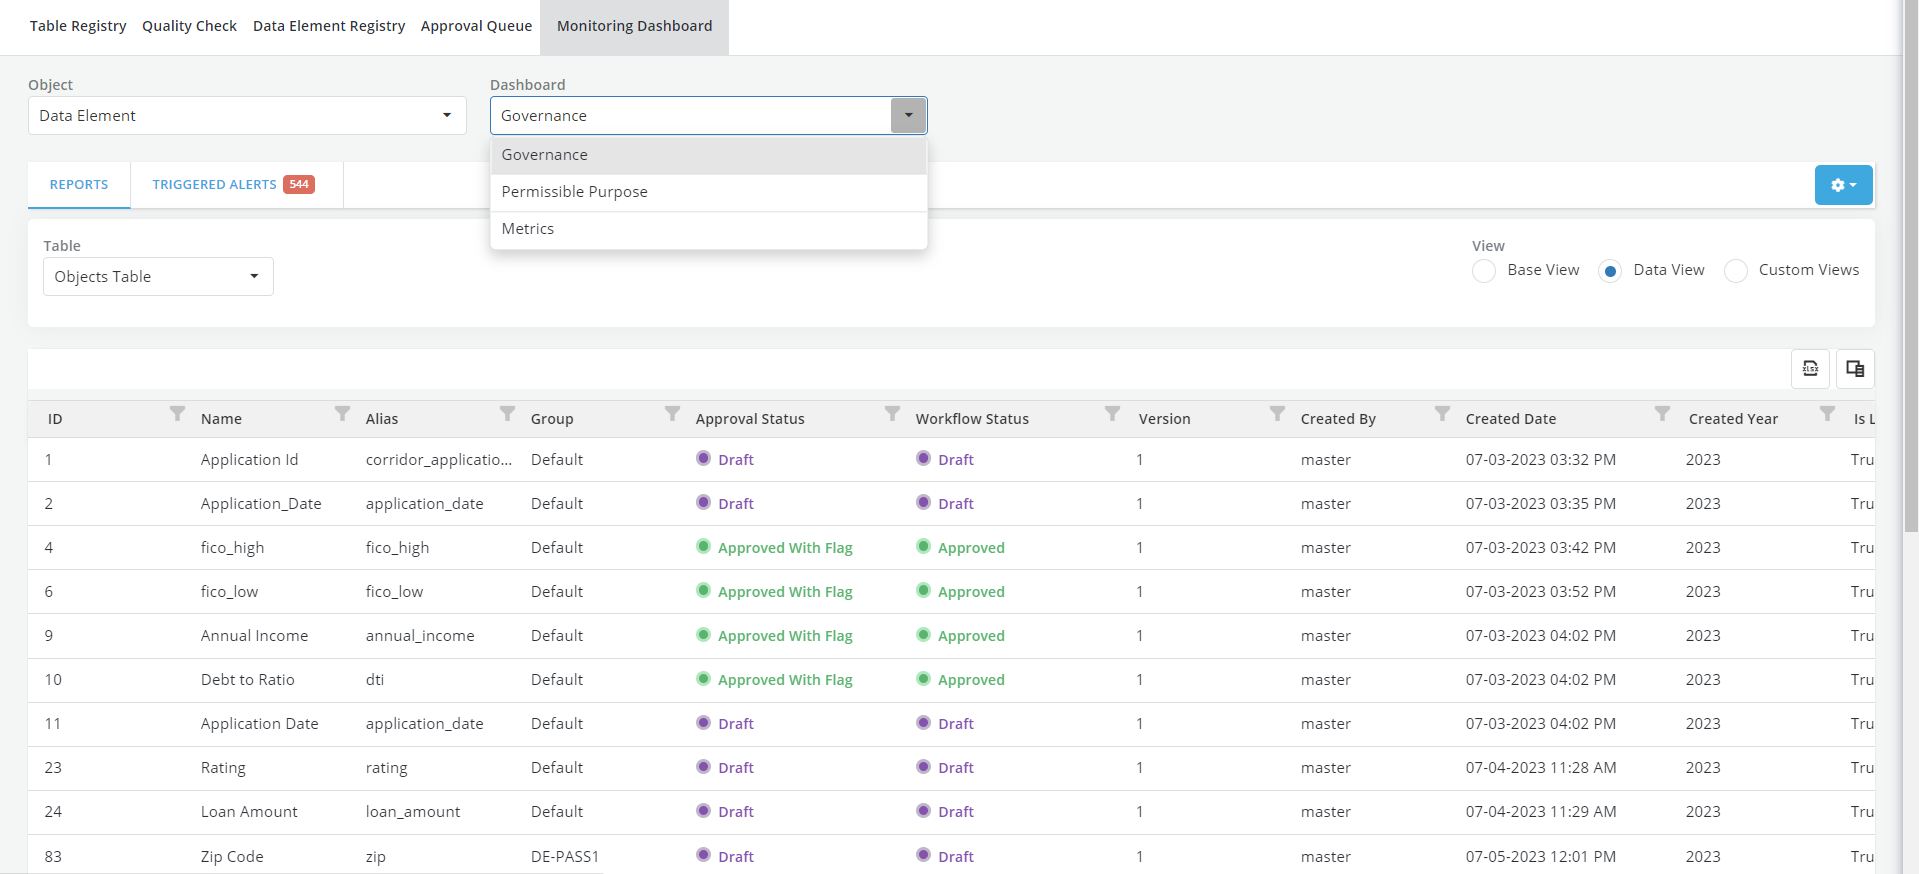
Click on Dashboard and select a Dashboard type from the dropdown menu.
For further information on the different dashboard types, refer to the following sections.
-
Click on Table and select the table type from the dropdown menu.
-
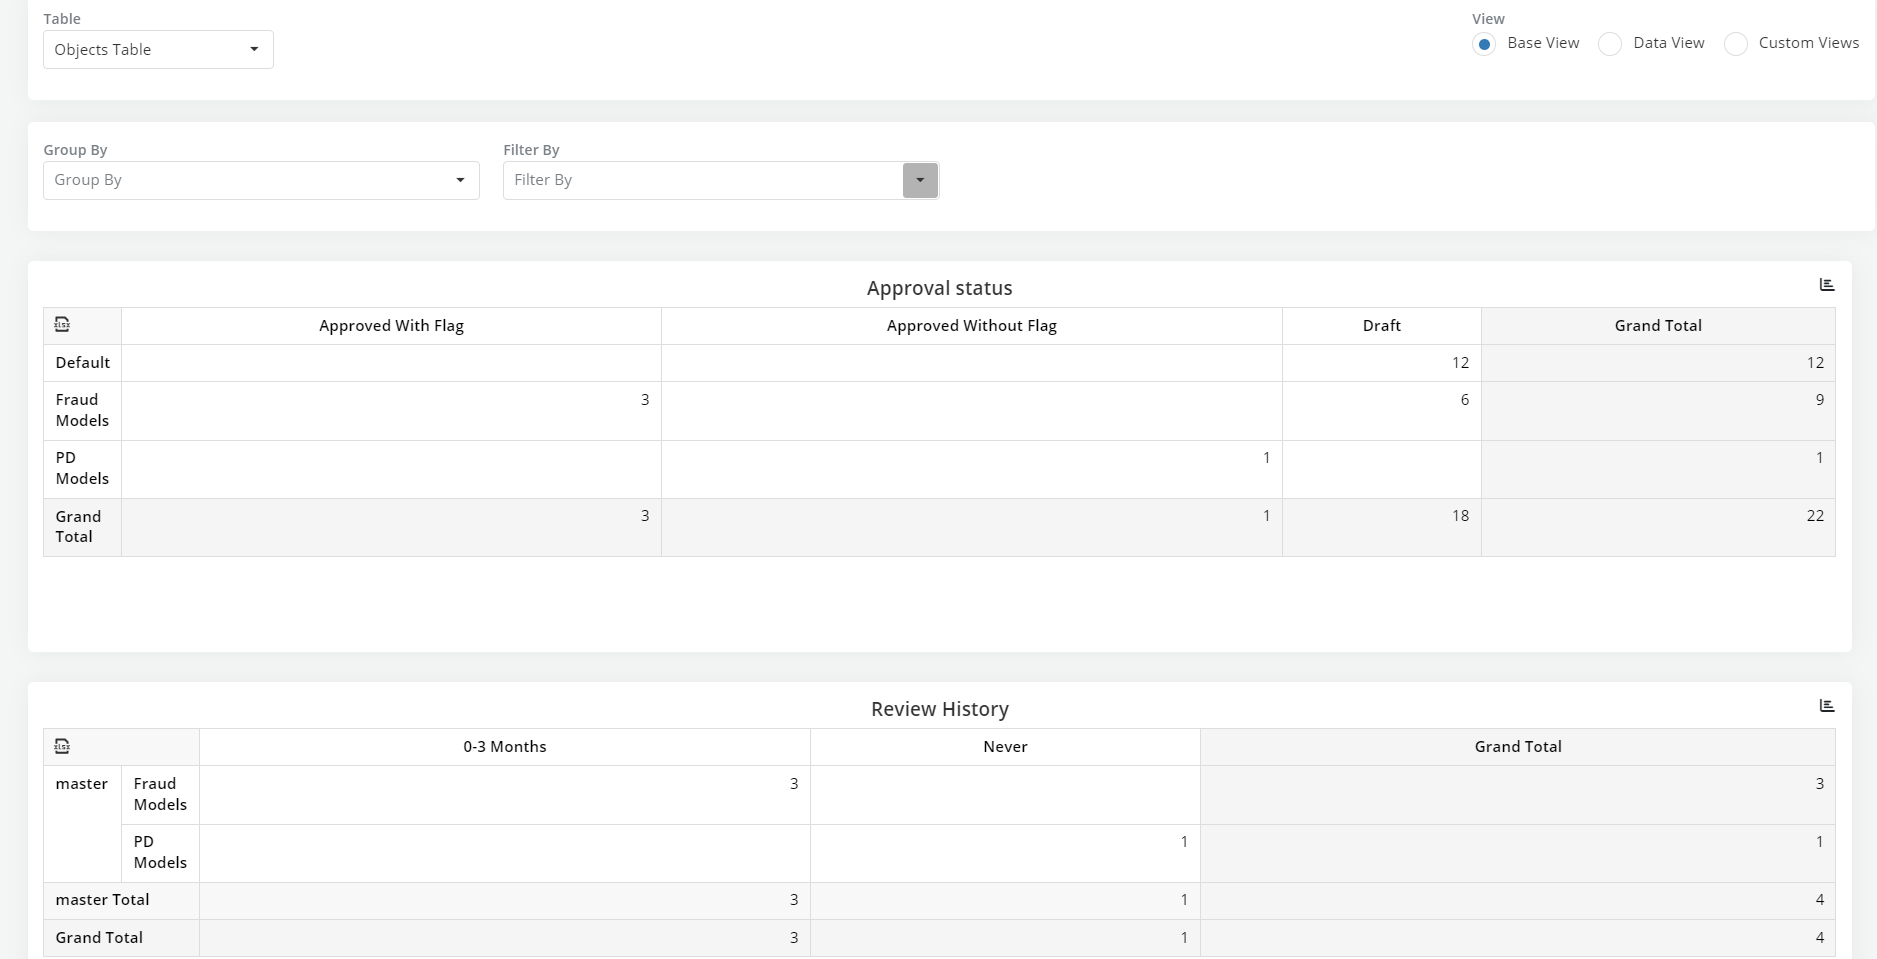
Objects Table: This table stores essential information about object metadata, including Group, Approval Workflow, and other relevant details.
-
Review Table: In this table, you can find comprehensive information regarding all the reviews conducted on the objects, encompassing both Approvals and Ongoing Reviews. Review tables are solely available within the Governance Dashboard.
-
User Table: The User Table exposes the metadata pertaining to user activity across the platform. Please note that the User Table is exclusively accessible through the "Settings" sub-menu option.
-
Exploring Monitoring Dashboard Views
-
While users have the option to customize views according to their preferences by setting up custom views, the monitoring dashboard offers two default views. Select the desired View by clicking on the radio buttons under View.
-
Base View: This is the default view that the organization decides to show to all users of the platform. It can be specified in Settings.
-
Data View: This view presents the complete data for the selected object type in a tabular format. Users can easily navigate to specific objects by clicking on the rows. Additionally, they can apply filters or sort rows based on any specified column.
-
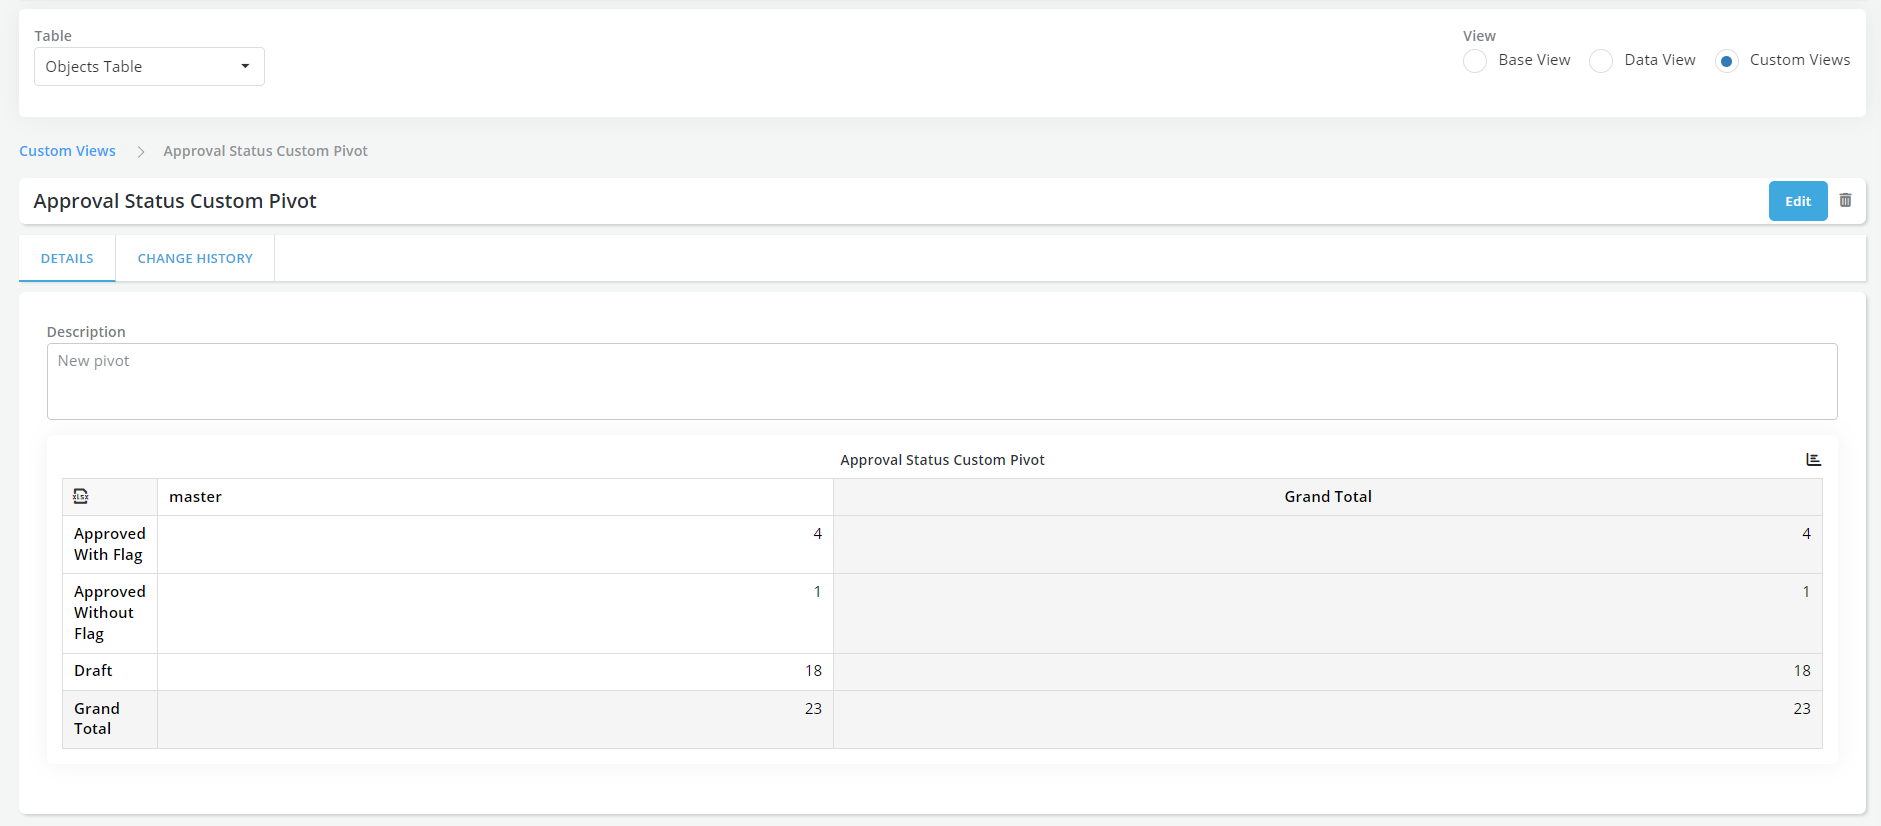
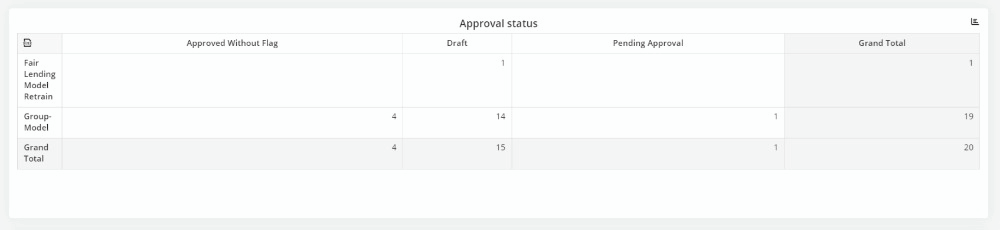
Custom View: With this view, users have the flexibility to tailor and configure custom pivot tables based on any of the object attributes, according to their unique preferences and analysis requirements.
-
-
Switching between Chart and Table Views: With just a click of a button, users can effortlessly toggle between chart and table displays, ensuring a seamless transition and enhanced ease of data comprehension.
- Navigate to a dashboard with tabular view.
- Click on Chart icon on top left corner of the table.
- Click again to toggle back to tabular view.
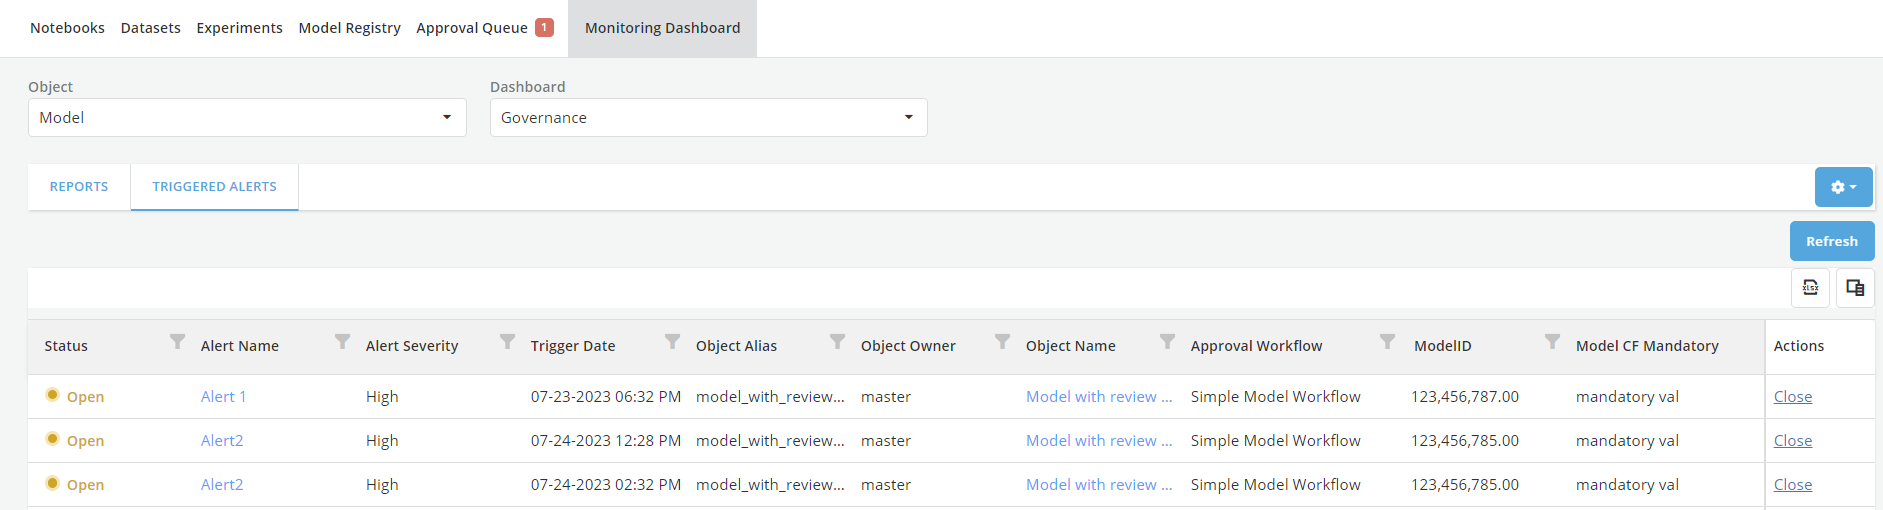
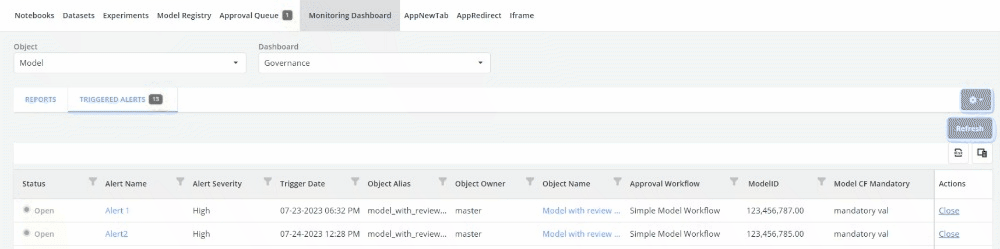
Monitoring Dashboard Triggered Alerts
Alerts are defined as a set of rules that are designed to identify specific items or events that require immediate attention or further action. These rules are created based on predefined criteria, enabling the system to detect critical situations, anomalies, or deviations from expected behavior. When the conditions specified in the alert rules are met, the system triggers events such as notifications, emails etc,. ensuring that appropriate actions can be taken promptly to address the identified issues.
View Triggered Alerts
- Navigate to Monitoring Dashboard.
- Click on TRIGGERED ALERTS tab.
- Click on Column Chooser to configure the view with desired table columns
- Click on xlsx icon to download the data to excel.
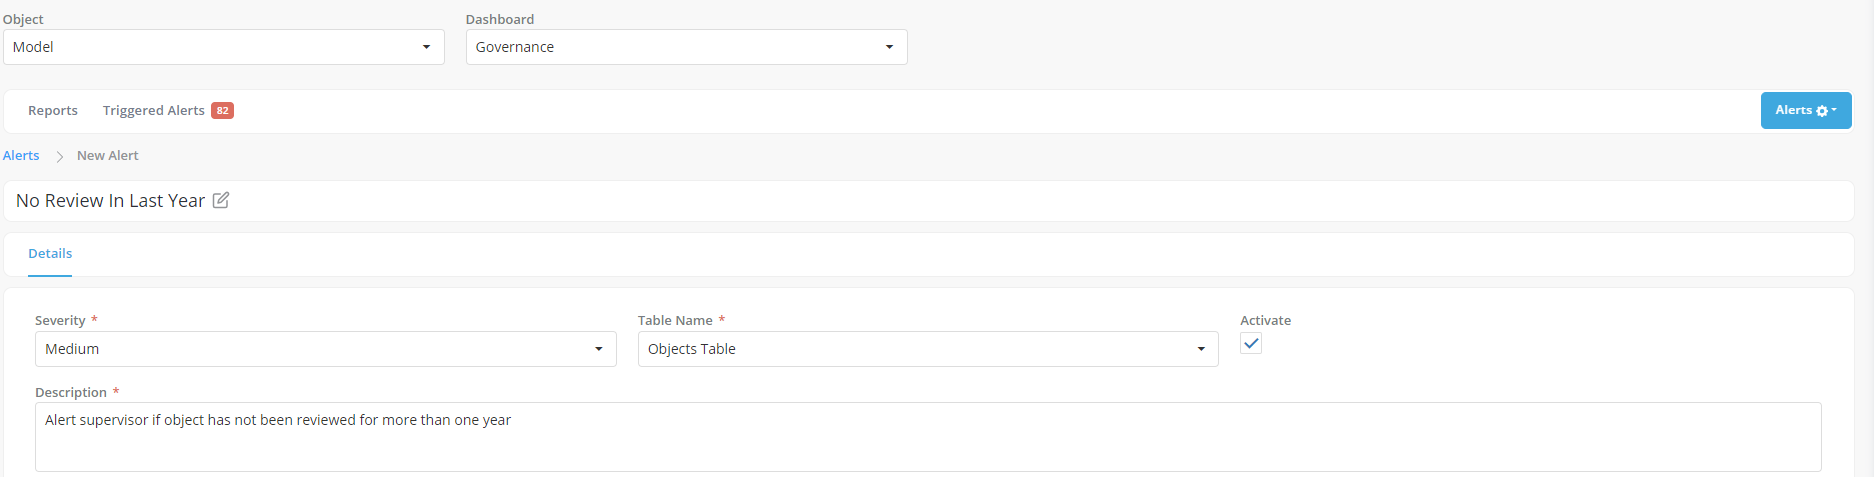
Create A Custom Alert
On the platform, users have the flexibility to create custom alerts tailored to their specific needs. Custom alerts encompass essential properties, including name, description, conditions, severity, and associated actions.
- Click on Settings icon and select Alerts in the dropdown menu option. Now you can view list of alerts configured for the dashboard.
- Click on Create.
- Define the Alert Name by editing the New Alert header.
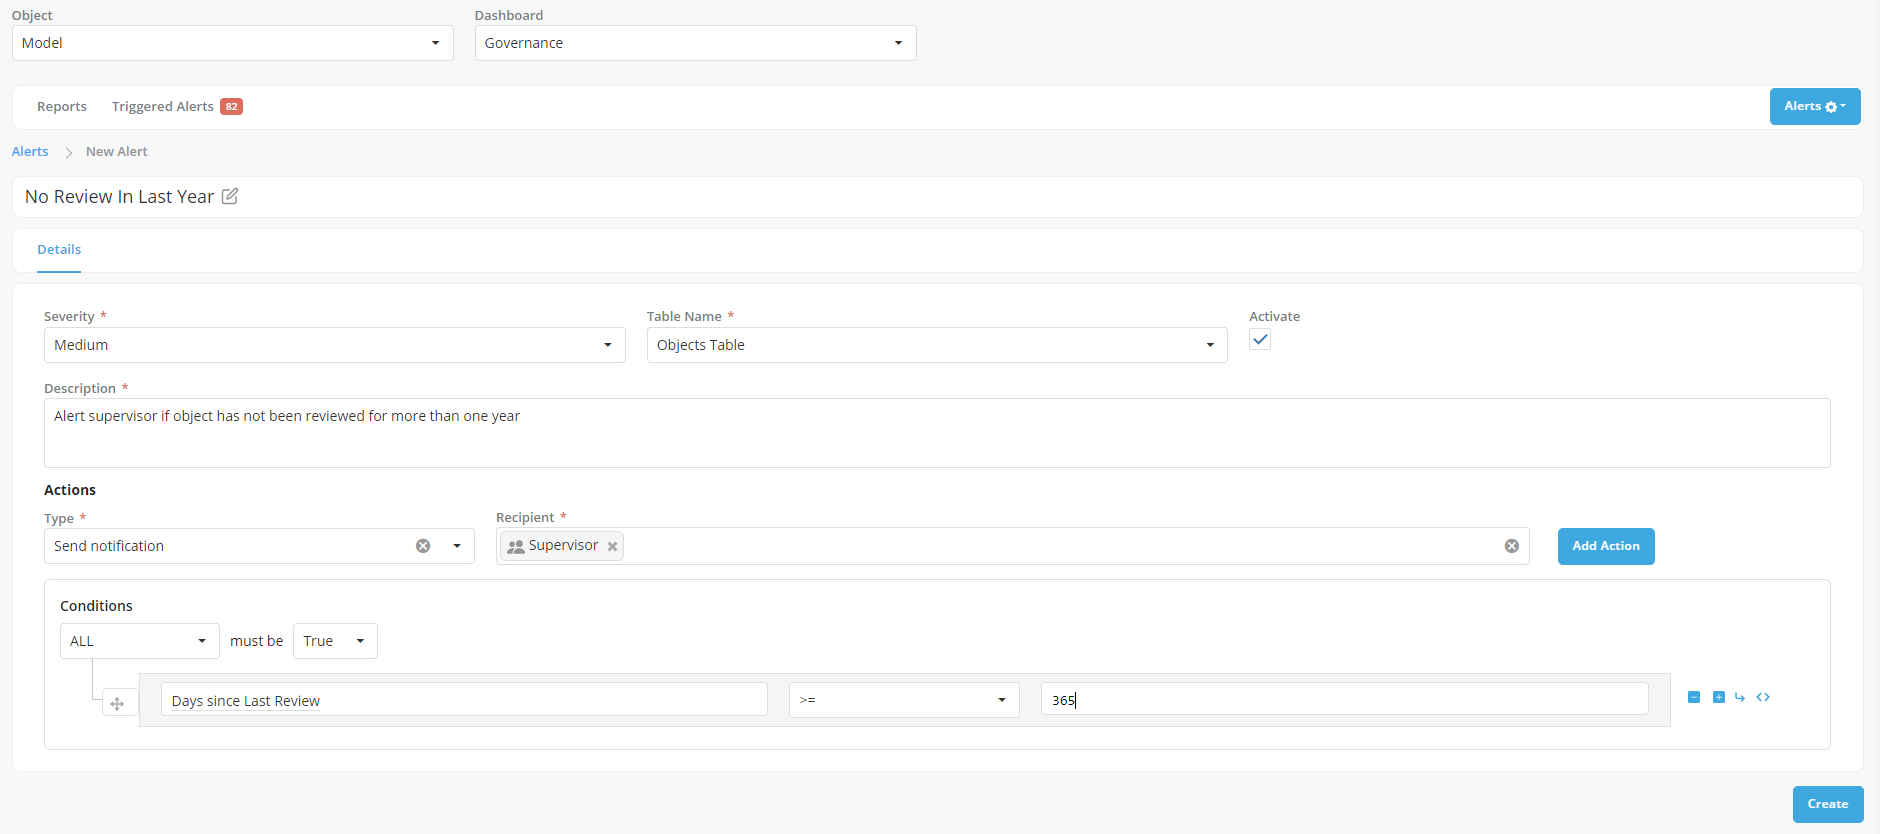
- Severity: Each custom alert can be assigned a severity level, such as High, Medium, or Low. This categorization allows users to prioritize alerts based on their importance and urgency. Different severity levels help stakeholders focus on critical issues
- Table Name: Select table name from the dropdown menu.
- Activate: Click the activate checkbox to mark the alert as active. Activated alerts are evaluated, and the corresponding data is displayed as columns in the Monitoring Dashboard. Muted alerts are temporarily disabled and not evaluated, meaning they won't appear as columns in the dashboard during that period.
-
Fill in the description for the new Custom Alert.
-
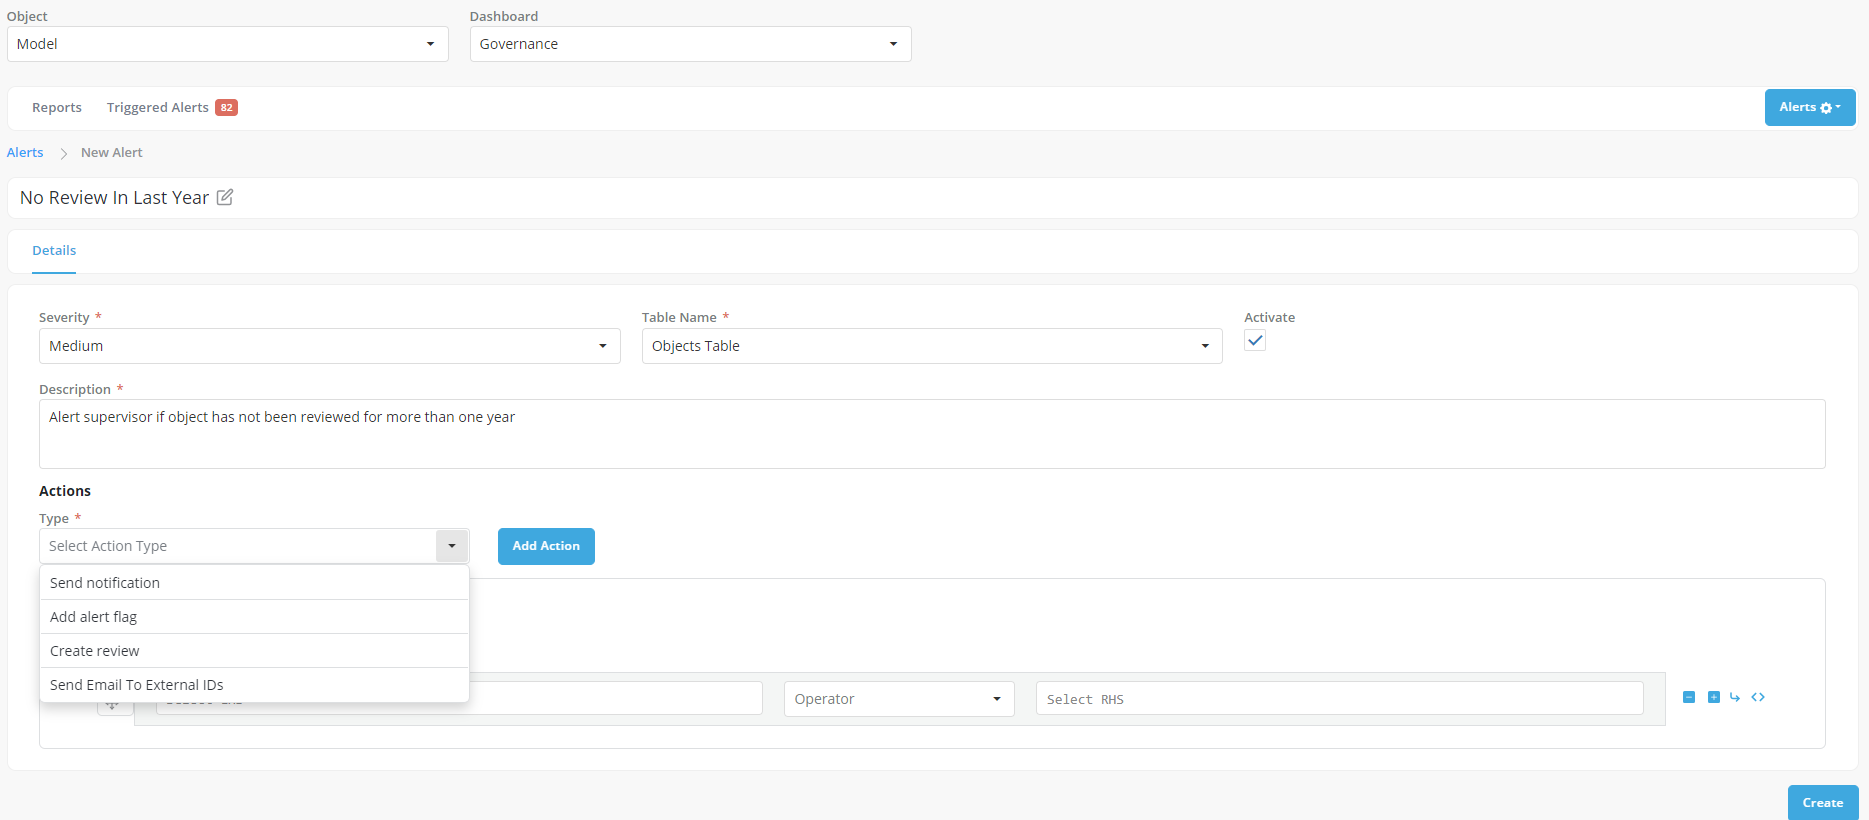
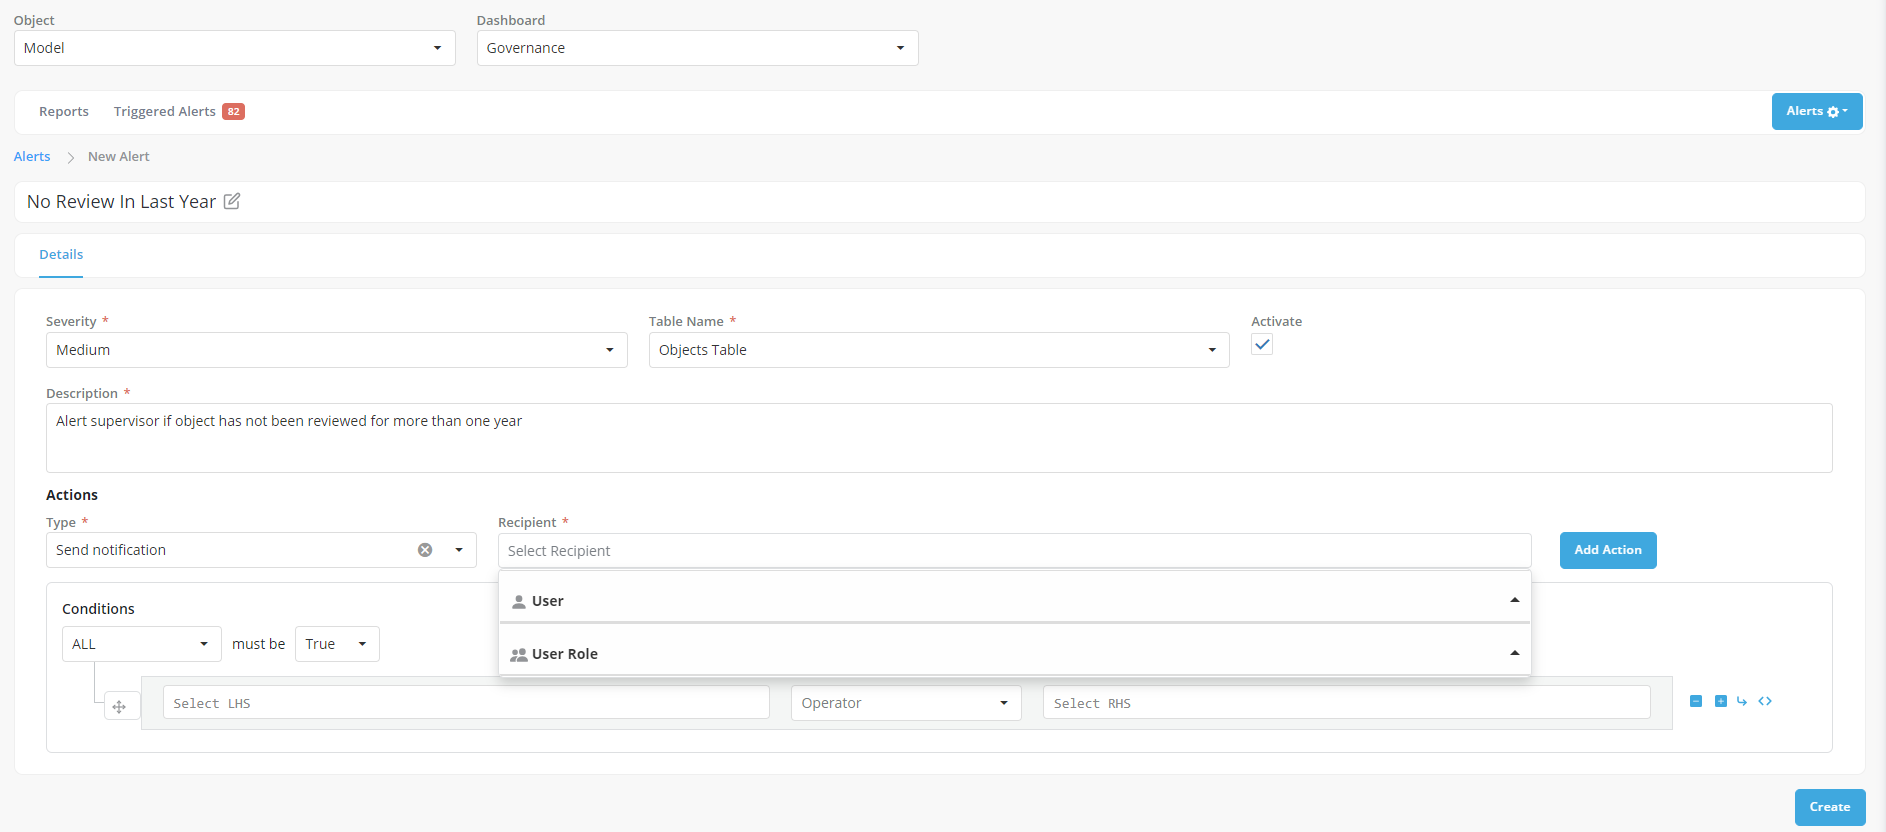
Actions Choose an action type from the "Type" dropdown menu to determine the action that will be executed when the alert is triggered. The following actions can be associated with custom alerts:
- Send Notification: The system can send notifications to selected users, or user roles informing them about the triggered alert. These notifications can be in the form of in-app messages.
- Add Alert Flag: When an alert condition is met, users have the option to add a predefined flag to the object responsible for the alert. Flags serve as visual indicators to highlight objects that require attention.
- Create Review: For Approved objects, users can choose to add an ongoing review to the object's responsibility and assign reviewers. This action facilitates a thorough review process for objects flagged by the custom alert.
- Send Email: Users can configure the system to send email notifications to external users when an alert is triggered. The custom field associated with the objects should contain a string of comma-separated email addresses for users who should receive these emails.
For Notifications select users and/r user roles to notify
Note: To add more than one action click on Add Action button.
-
Conditions: Define the conditions that need to be met for an alert to be generated. These conditions are specified using rules based on the columns available in the Monitoring Dashboard Data. By utilizing data from the dashboard, users can set up criteria that trigger the alert when specific thresholds or patterns are detected.
-
Click on Create to register the alert. A pop-up toast message will be displayed with text reading Alert Created Successfully.
Note : Ensure that you do not include the following special characters (colon, square brackets, period) within the names of Permissible Purpose, Alerts, Custom Fields or Reports. If these values are added to the names of these properties, the respective object's values may not be displayed on the monitoring dashboard.