Overview
A dashboard is a graphical representation providing at-a-glance views of key information, metrics or indicators relevant to a particular object.
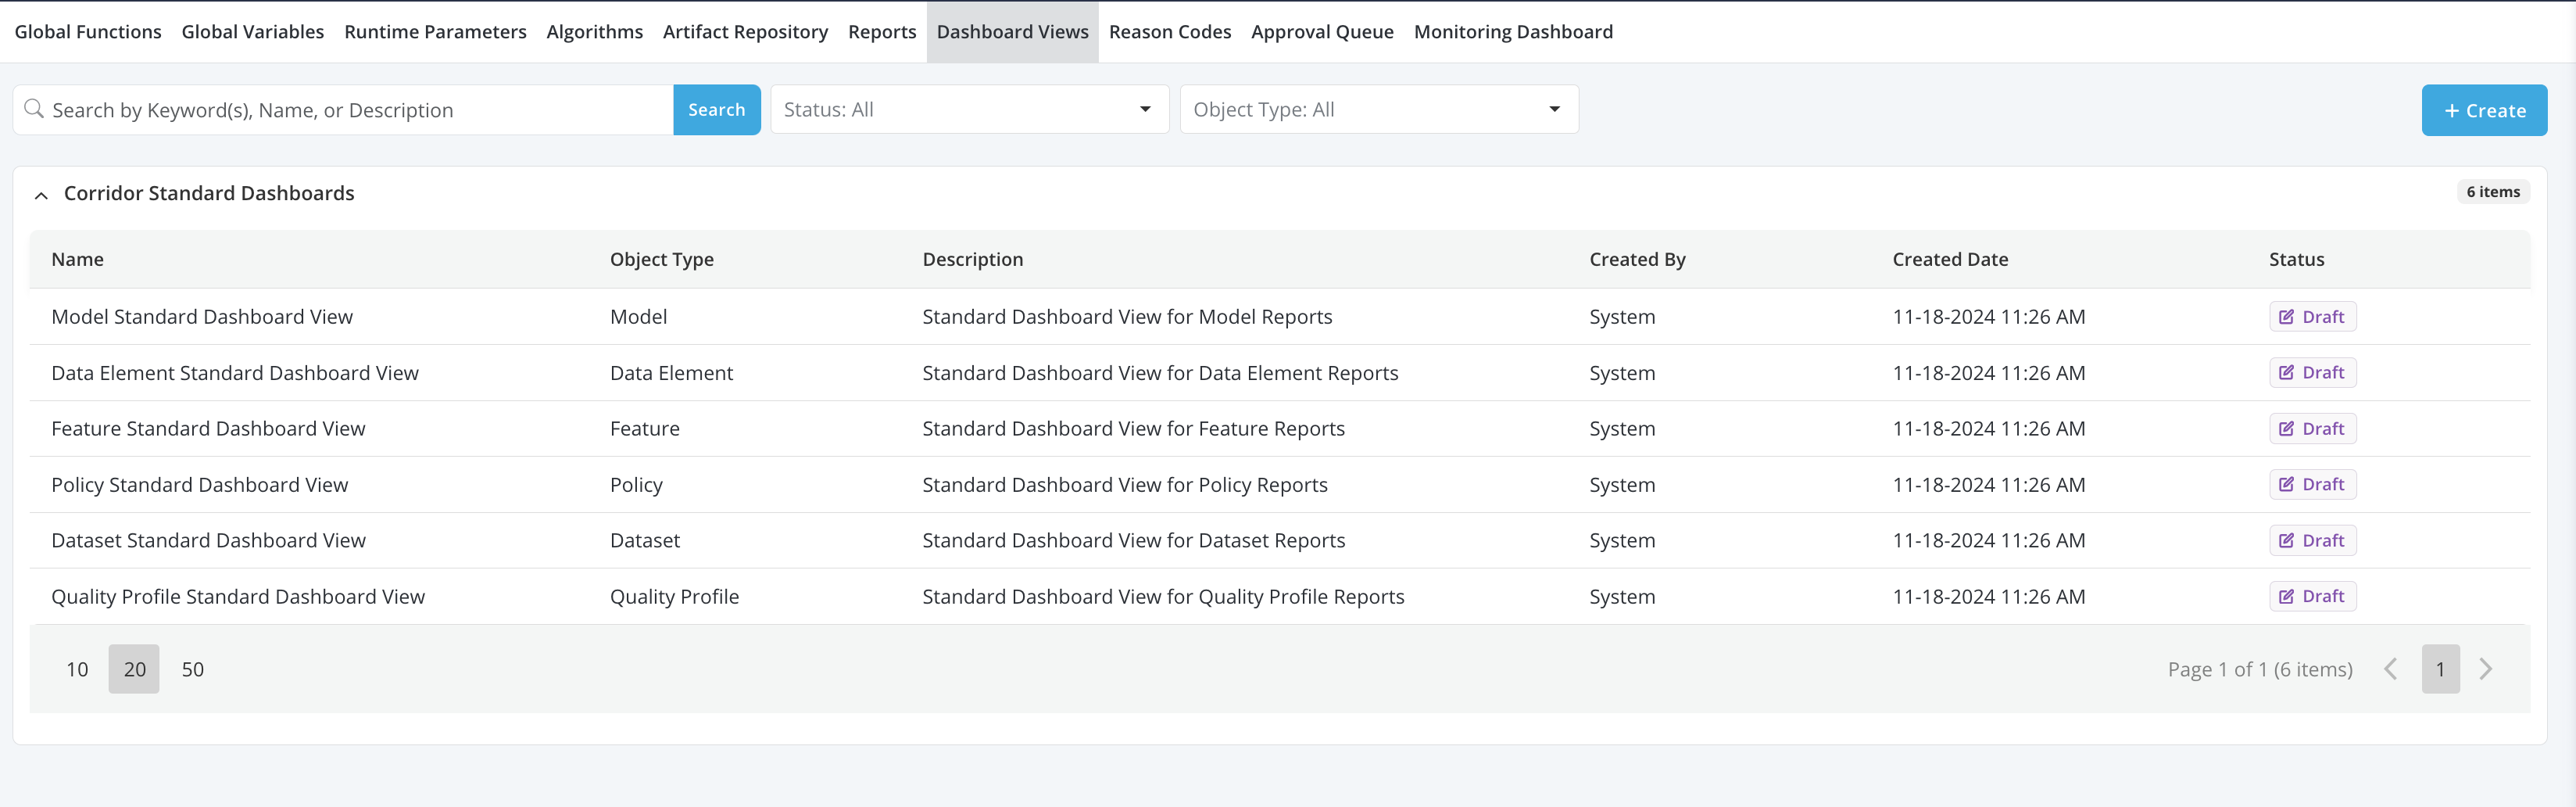
- The platform comes with a set of pre-registered Dashboards for quick analysis
- All pre-registered dashboards, along with the associated reports and global functions are registered under Resources as Draft objects and are accessible by users with Admin permissions.
Available Reports For Each Pre-Registered Dashboards
-
Quality Check Dashboard
-
Tab1: Rules Output
- Report1: Rule Pass Fail Report
-
Tab2: Data Profile
- Report1: Data Profile Report
-
-
DataElement Dashboard
-
Tab1: Descriptive Statistics
- Report1: Histogram
- Report2: Summary Statistics
- Report3: Quantile Statistics
-
Tab2: Verification (available for verification job only)
- Report1: Mismatch Summary
- Report2: Mismatch Sample
-
-
Feature Dashboard
-
Tab1: Descriptive Statistics
- Report1: Histogram
- Report2: Summary Statistics
- Report3: Quantile Statistics
- Report4: Sample Report
-
Tab2: Verification (available for verification job only)
- Report1: Mismatch Summary
- Report2: Mismatch Sample
-
-
Model Dashboard
-
Tab1: Model Inputs
- Report1: Descriptive Statistics for each model inputs, including histogram, summary statistics, quantile statistics and relationship graph
-
Tab2: Model Dependent
- Report1: Histogram
- Report2: Summary Statistics
- Report3: Quantile Statistics
-
Tab3: Model Output
- Report1: Histogram
- Report2: Summary Statistics
- Report3: Quantile Statistics
-
Tab4: Feature Importance (available for model registered with explainer only)
- Report1: Feature Importance
-
Tab5: Model Quality
- Report1: Actual VS Predicted
- Report2: Key Metrics
- Report3: Lift Curve
- Report4: ROC Curve
- Report5: Decile Table
- Report6: Regression Error (available for regression model only)
-
Tab6: Verification (available for verification job only)
- Report1: Mismatch Summary
- Report2: Mismatch Sample
-
Tab7: Stability (available for validation job only)
- Report1: PSI Table
- Report2: CSI Table
-
-
Dataset Dashboard
-
Tab1: Descriptive Statistics
- Report1: Descriptive Statistics for each inputs selected for the Dataset, including histogram, summary statistics, quantile statistics and relationship graph
-
-
Policy Dashboard
-
Tab1: Policy Results
- Report1: Strategy Funnel
- Report2: Approval Rates
- Report3: Expected Volume
-
Tab2: Strategy Results
- Report1: Strategy Pass Fail Report
- Report2: Strategy Cumulative Pass Fail Report
- Report3: Swapset Analysis (available for comparison job only)
-