Policy Summary
Overview
This is one of the tabs that are included in the results of a policy simulation. It contains a summary of the policy output at an aggregate level.
Currently, the default charts included in the Policy summary are:
- Funnel
- Pass Rates
- Pass Volumes
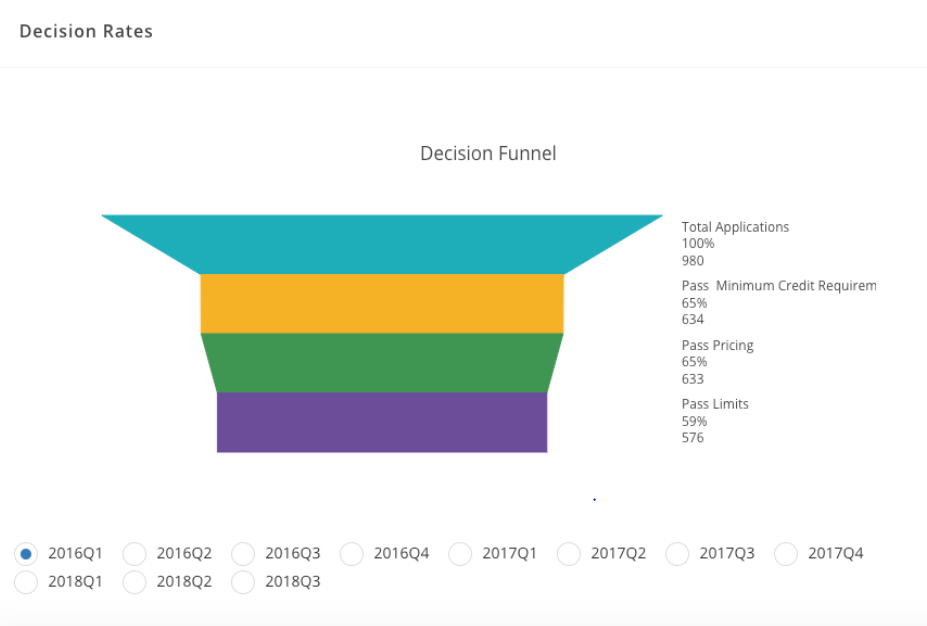
Funnel
The funnel shows the sequential pass rates across the different strategies rank-ordered by order of display in the Strategies tab.
Pass Rates
The pass rates show the percentage of records in the simulation sample that pass all the strategies in the policy.

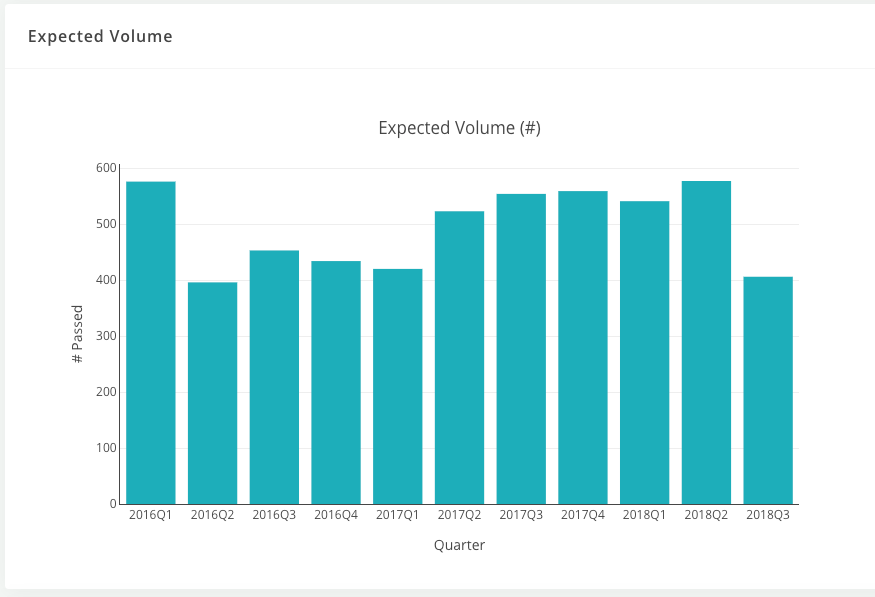
Pass Volumes
The pass rates show the count of records in the simulation sample that pass all the strategies in the policy