Setting up Model Monitoring Performance Post Approval
Overview
This Use case illustrates tracking the performance of the model over a period of time in an automated way, specifically watch for model degradation and take the decisions timely. After the Model is registered and approved on the platforms post going through the approval workflow, the model is available as an artifact in the Platform. The Modeler can give the artifact to the production team for deployment. Platform automatically stitches together a standalone artifact that can be deployed seamlessly in the production systems. The artifact can score in batch (on Spark cluster) or real-time mode (on python) and exactly mirrors the logic developed during the analytic build process.
In the example below, we will go over components that are required to set up model monitoring. First thing we need to capture the data coming into the platform and set up the mechanism for it.
Example-Monitoring of PD Model
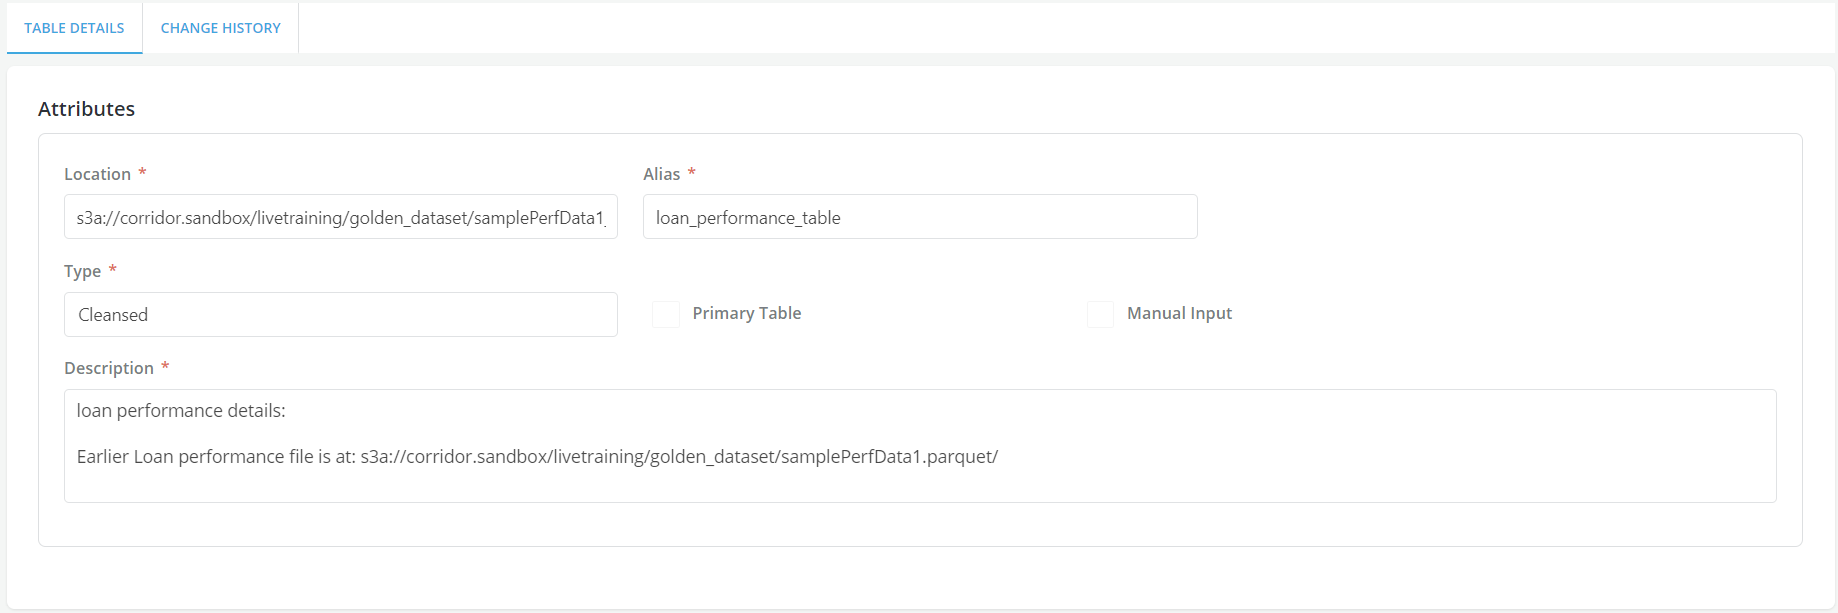
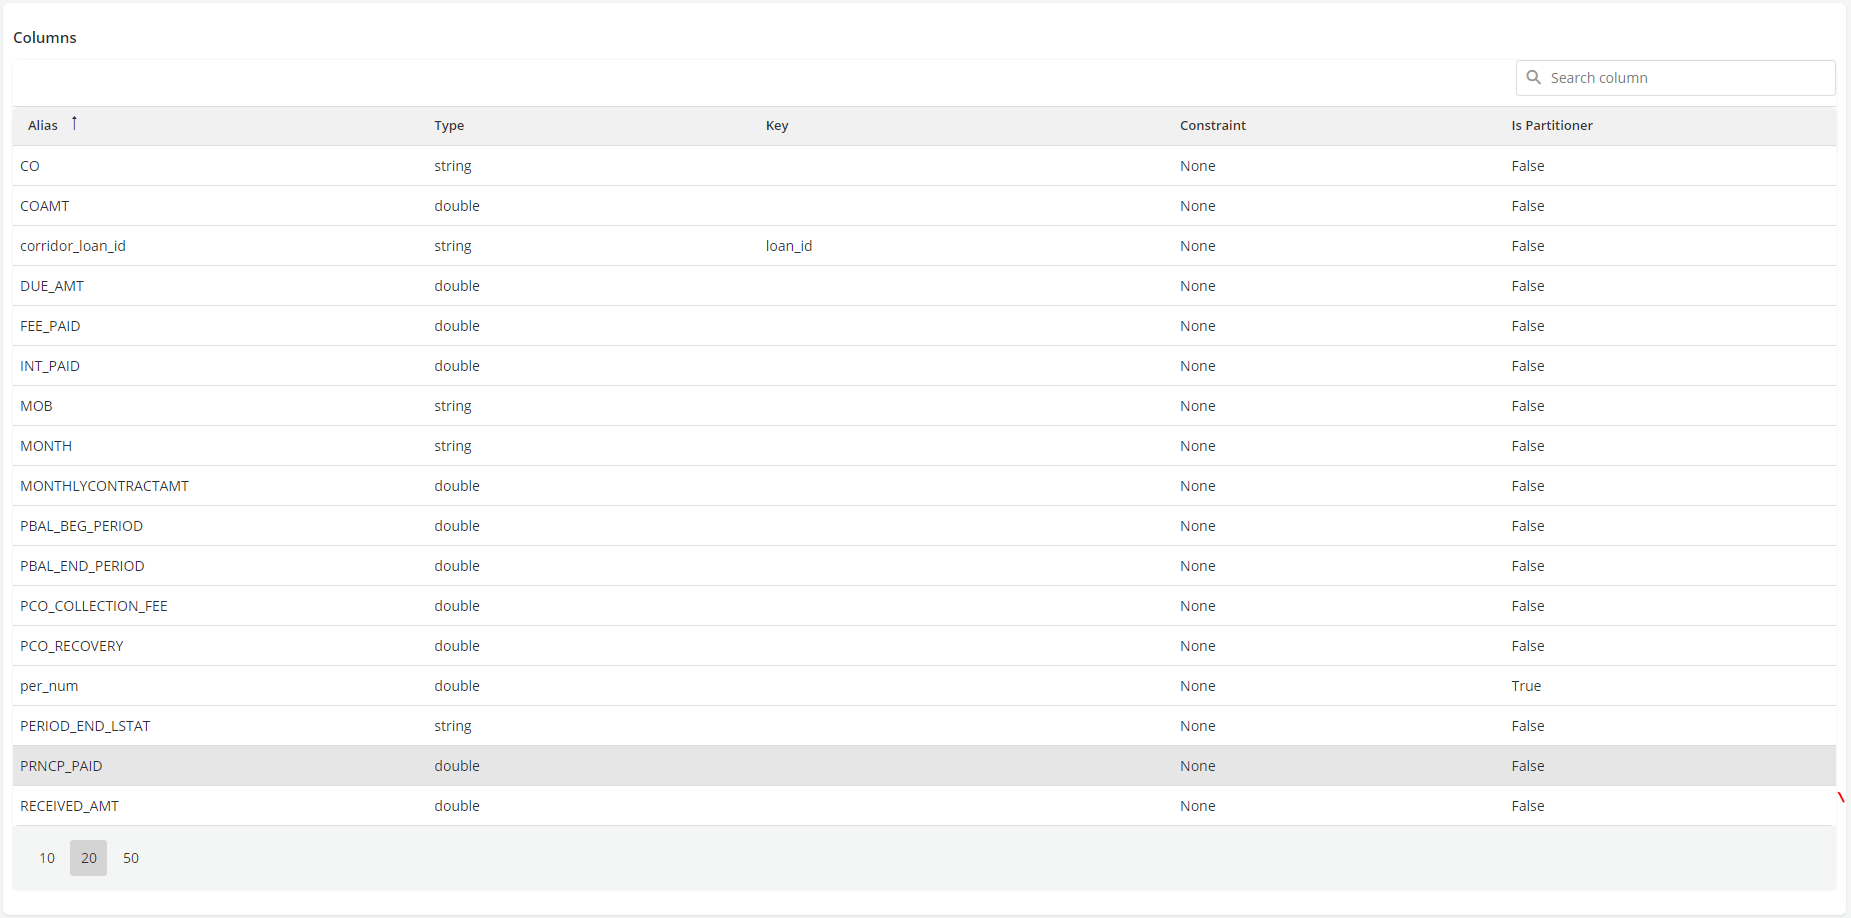
- Here, since this is a loan performance data coming to the platform about the payment information on the loans that got originated because of the decision logic that was created. The screen shot shows loan performance table, which is a detail table to the primary loan/Account table. Every month, the payment information is being collected on all outstanding loans, so if the loan is outstanding for 15 months, the table will have 15 records for that particular Loan/ Account ID, capturing payment information from the point of origination to 15 months thereafter. So the information that comes in MOB, due amt- unique corridor loan id etc. So the information is getting appended to this particular table on a monthly basis. The data file gets appended with new information and that is how the feedback loop is managed in the Platform.
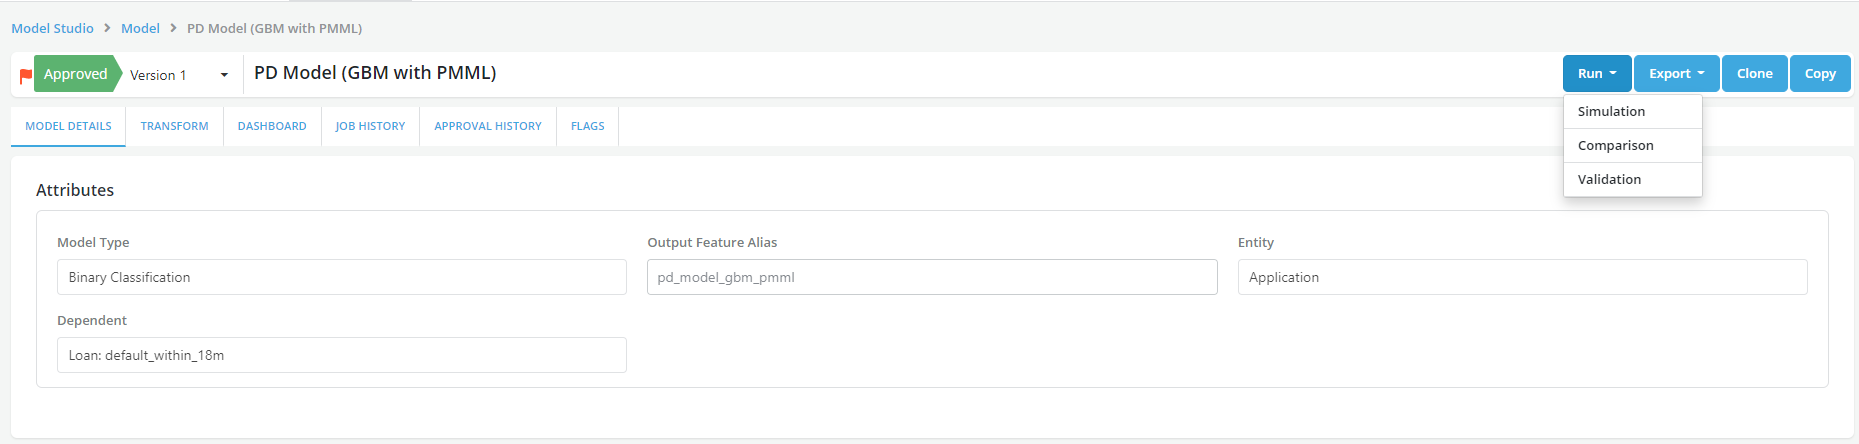
- Once the data starts coming into the Platform, it gives the ability to go the model and set up a scheduled run which could be scheduled Simulation, Validation or a Comparison. Here we would schedule a Validation which would basically monitor the model against a benchmark at the point where the model was approved.
-
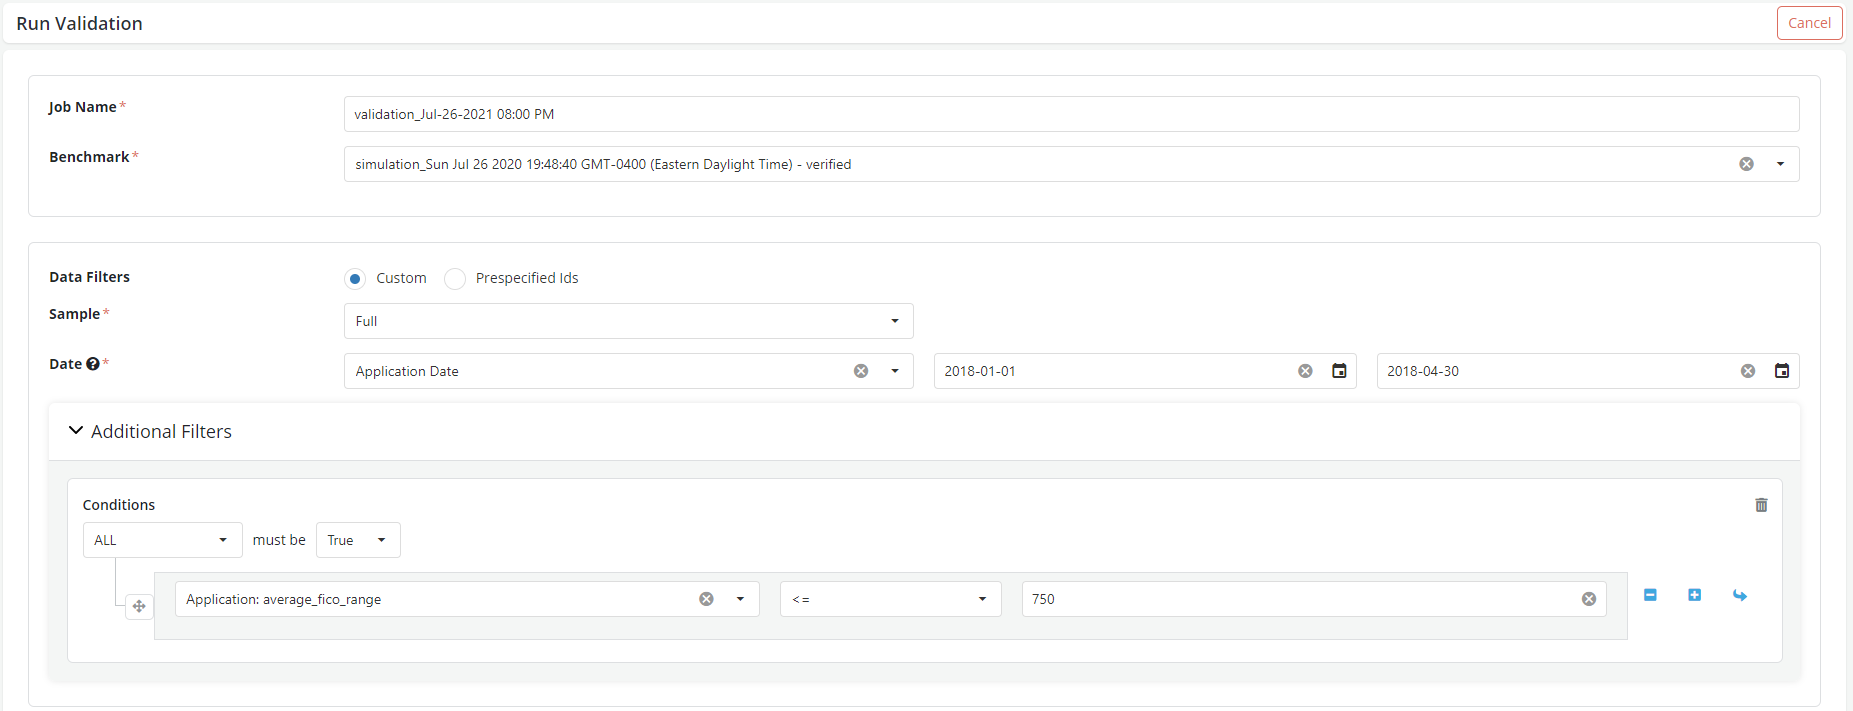
Select the benchmark simulation was selected.
-
Select the window for the scheduled Validation. Choose the date column and set the date range. In this case we are trying to set the validation on a segment of applicants and track how the model performs on certain segment.
-
Set the Additional filters to run Validation on certain segment, here Average FICO range is taken as LHS which should be equal to 750.
-
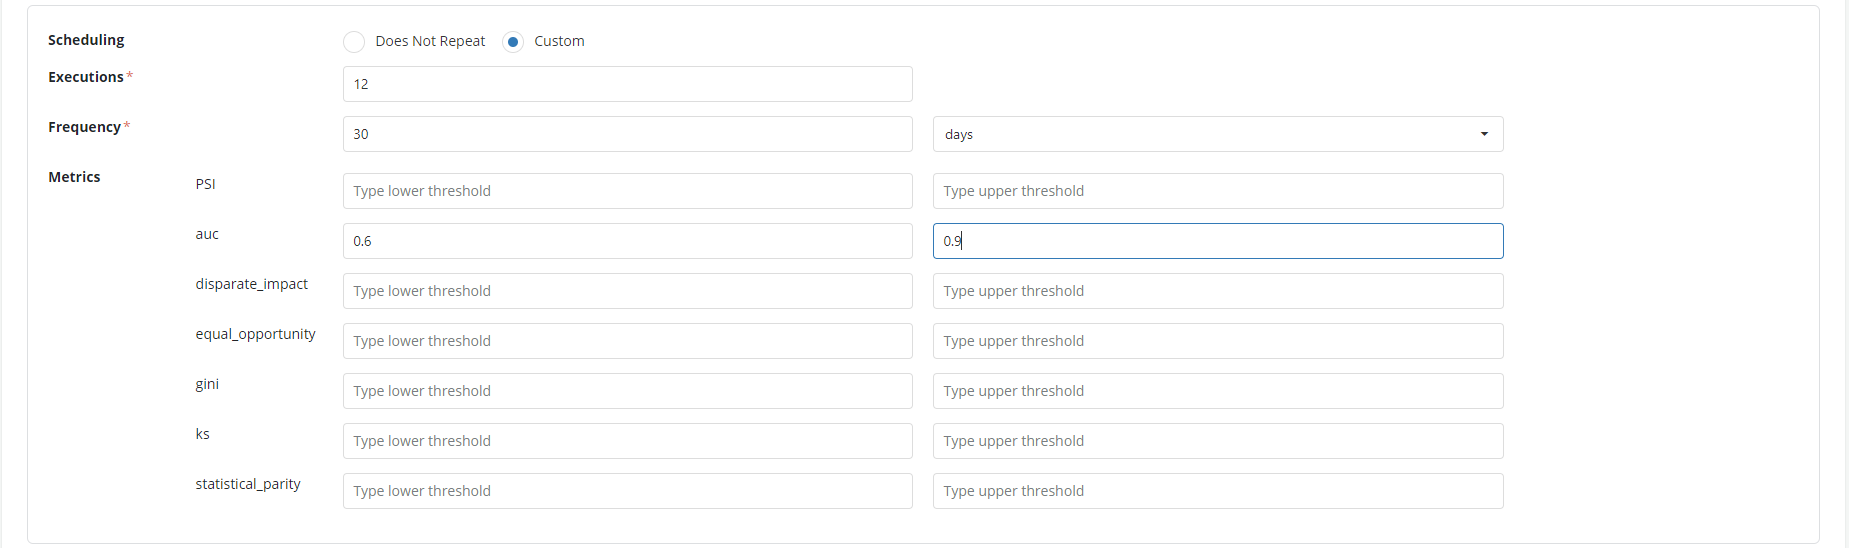
Select scheduling as Custom and set up the following fields.
• Execution- how many times you want to execute the validation and monitor the model. Here the frequency is set as 12 as we want to track the performance over a year. • Frequency- what is the frequency of the run. In this case it is once in 30 days • Metrics- Set up the metrics as required. In the example here the AUC is set up from 0.6 to 0.9 (lower and higher threshold)
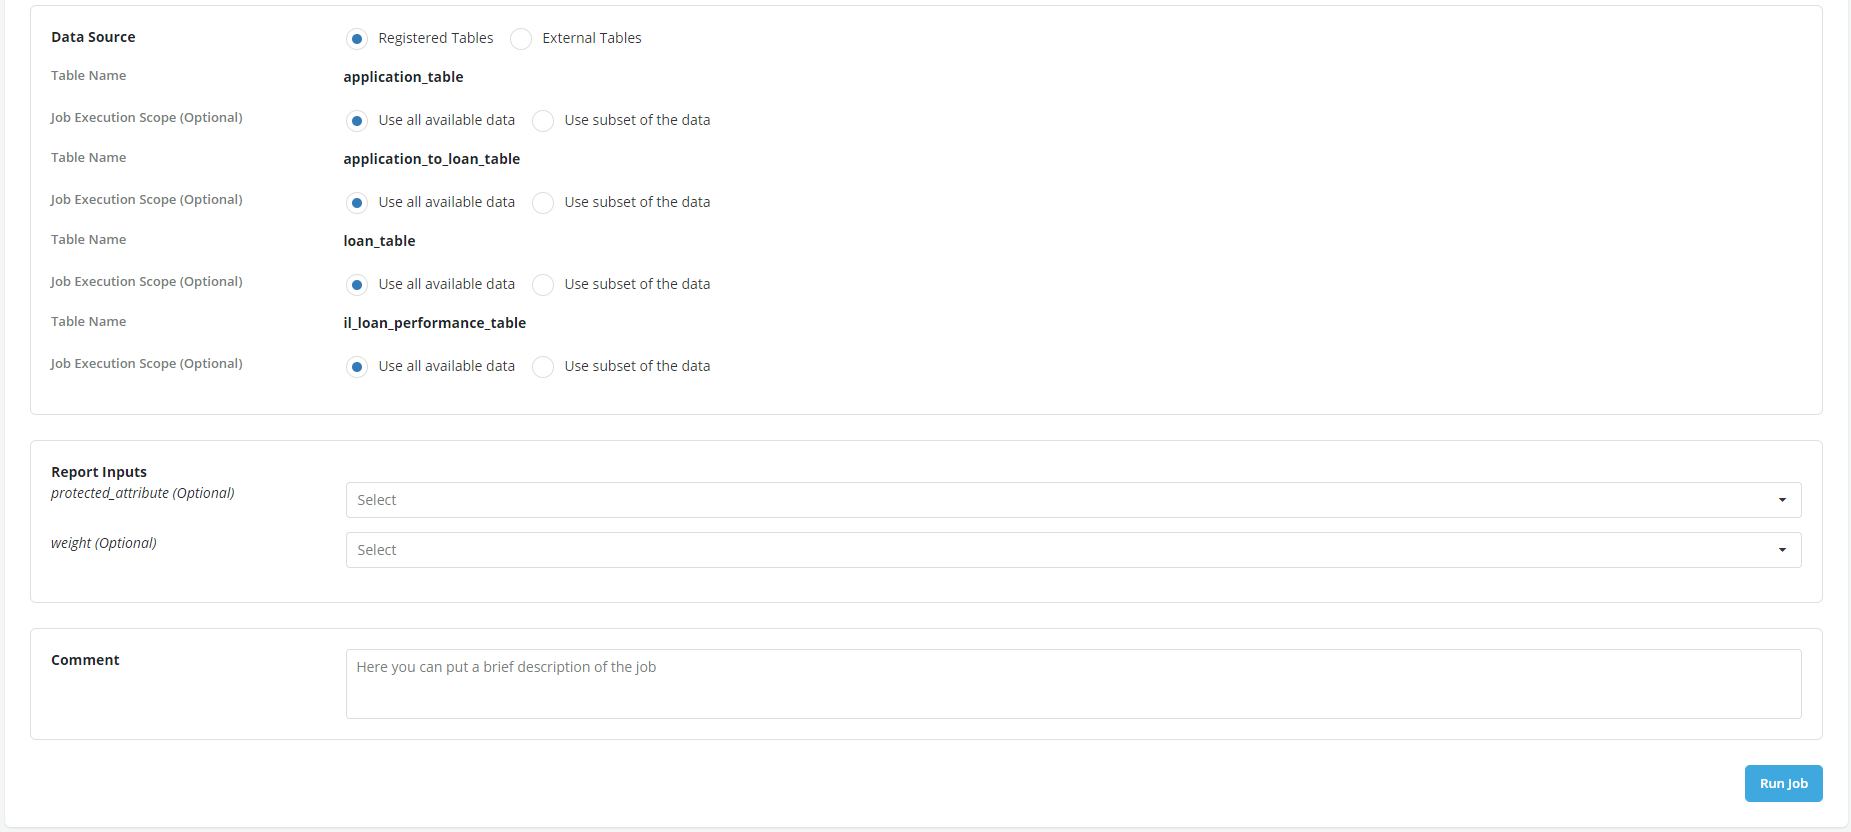
-
Since the data is coming back to the platform to be appended, registered data tables are used as Data Source. So now a run is scheduled for a year which will run 12 times, once every 30 days particularly monitoring the metrics set up during the run. Click Run job to schedule the job.
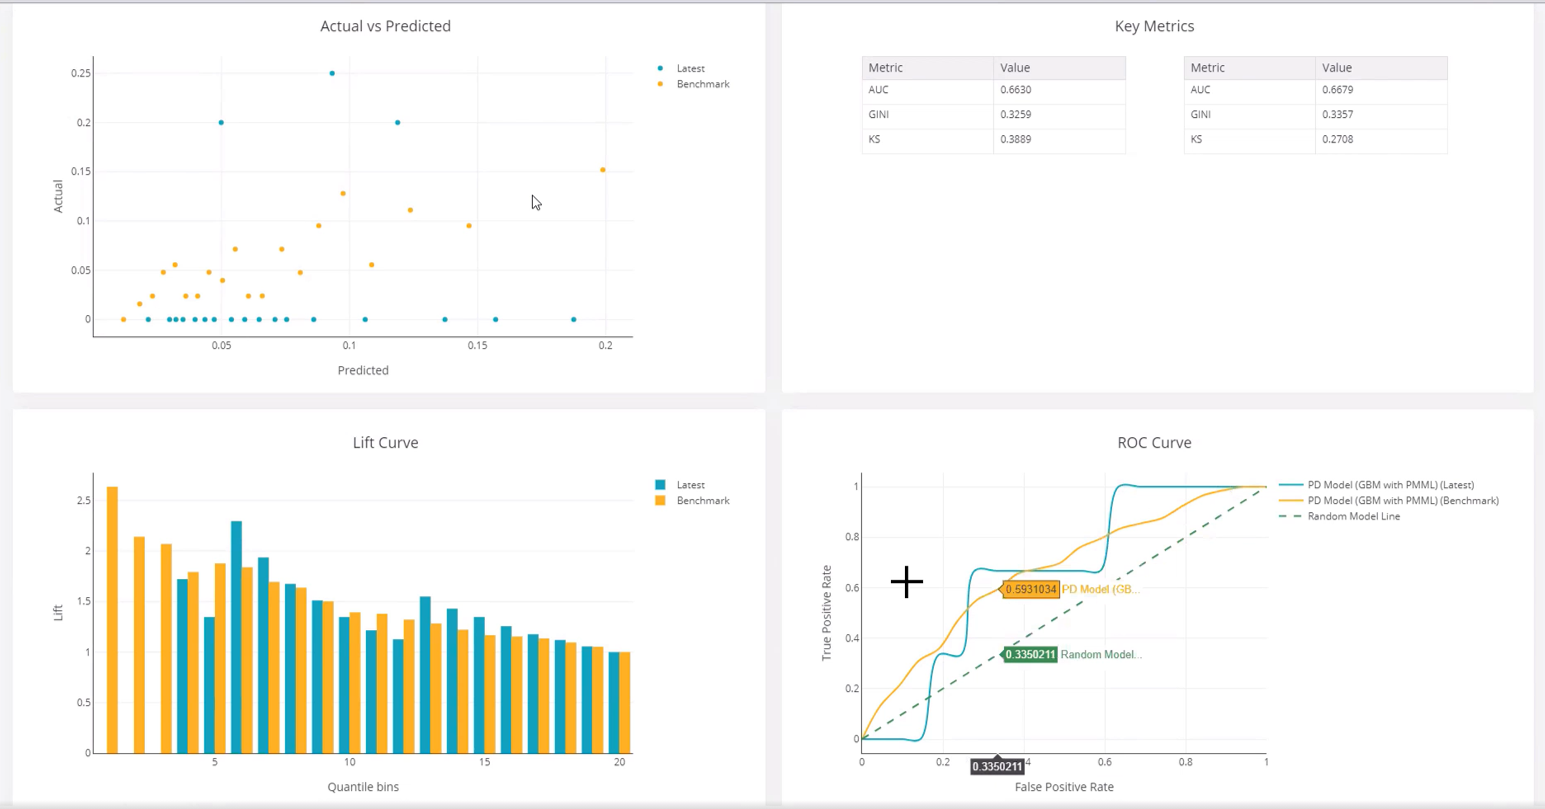
- Now the platform is tracking the performance of the model over multiple iterations. So, you can see how the model is performing over the moving window. Open the run (validation) and review the model performance in the Tracking and Model Quality tabs.
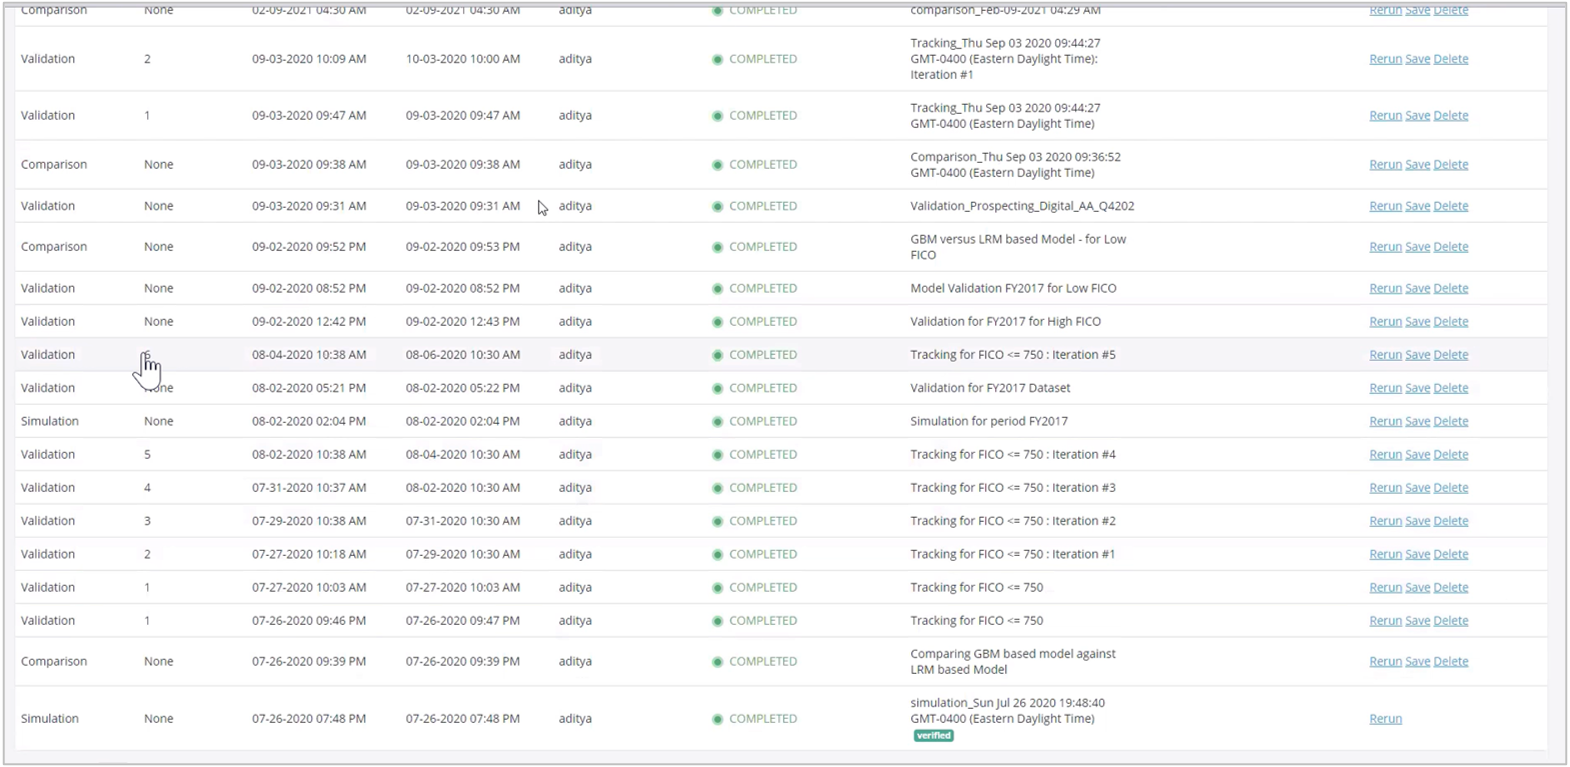
- You can see the results in the Tracking tab and observe the behavior of the model how is it performing over the period time.
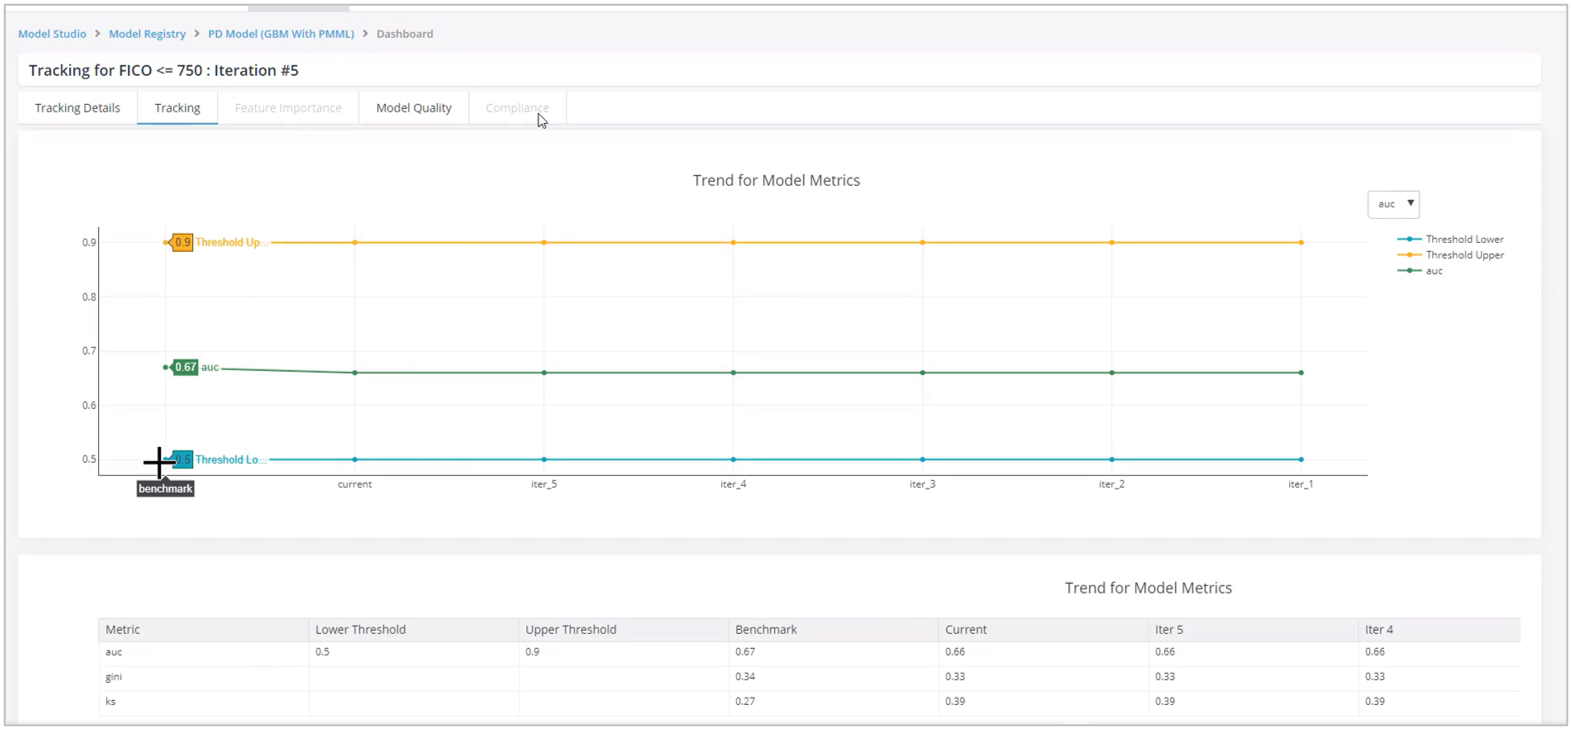
- In the Model Quality, it can be sees that the model performance shows a visible variance as compared to the benchmark.